- Container Networking Is Simple!
- What Actually Happens When You Publish a Container Port
- How To Publish a Port of a Running Container
- Multiple Containers, Same Port, no Reverse Proxy...
- Service Proxy, Pod, Sidecar, oh my!
- Service Discovery in Kubernetes: Combining the Best of Two Worlds
- Traefik: canary deployments with weighted load balancing
Don't miss new posts in the series! Subscribe to the blog updates and get deep technical write-ups on Cloud Native topics direct into your inbox.
How services talk to each other?
Imagine you're developing a service... For certainty, let's call it A. It's going to provide some public HTTP API to its clients. However, to serve requests it needs to call another service. Let's call this upstream service - B.
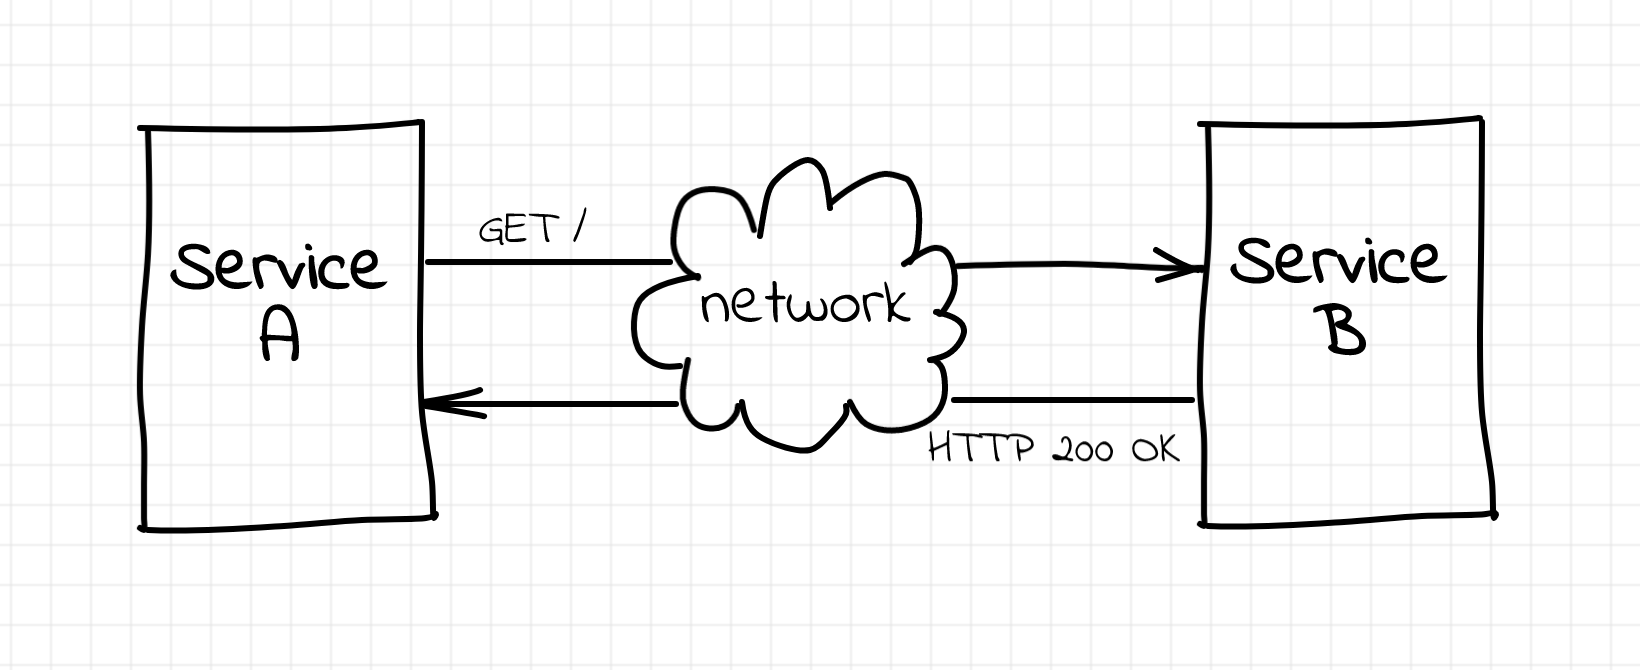
Obviously, neither network nor service B is ideal. If service A wants to decrease the impact of the failing upstream requests on its public API success rate, it has to do something about errors. For instance, it could start retrying failed requests.
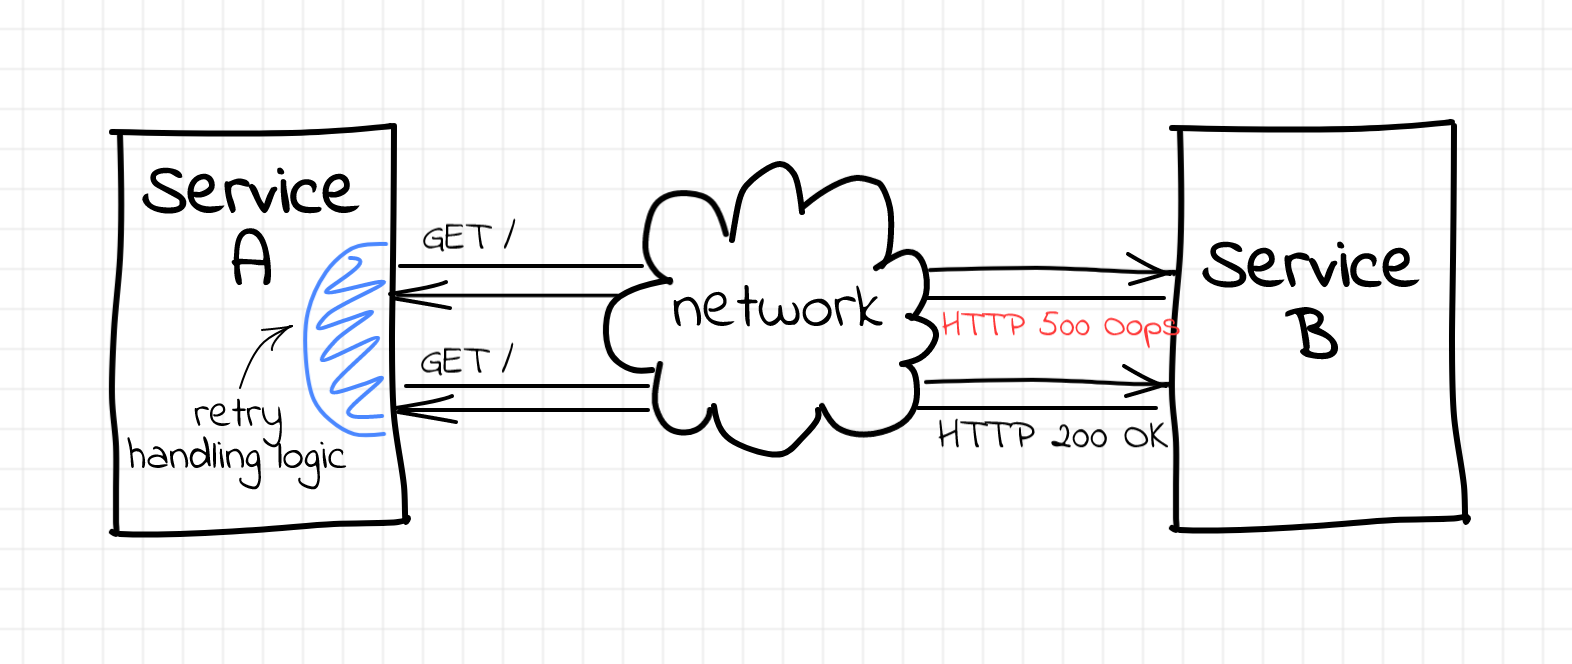
Implementation of the retry mechanism requires some code changes in the service A, but the codebase is fresh, there are tons of advanced HTTP libraries, so you just need to grab one... Easy-peasy, right?
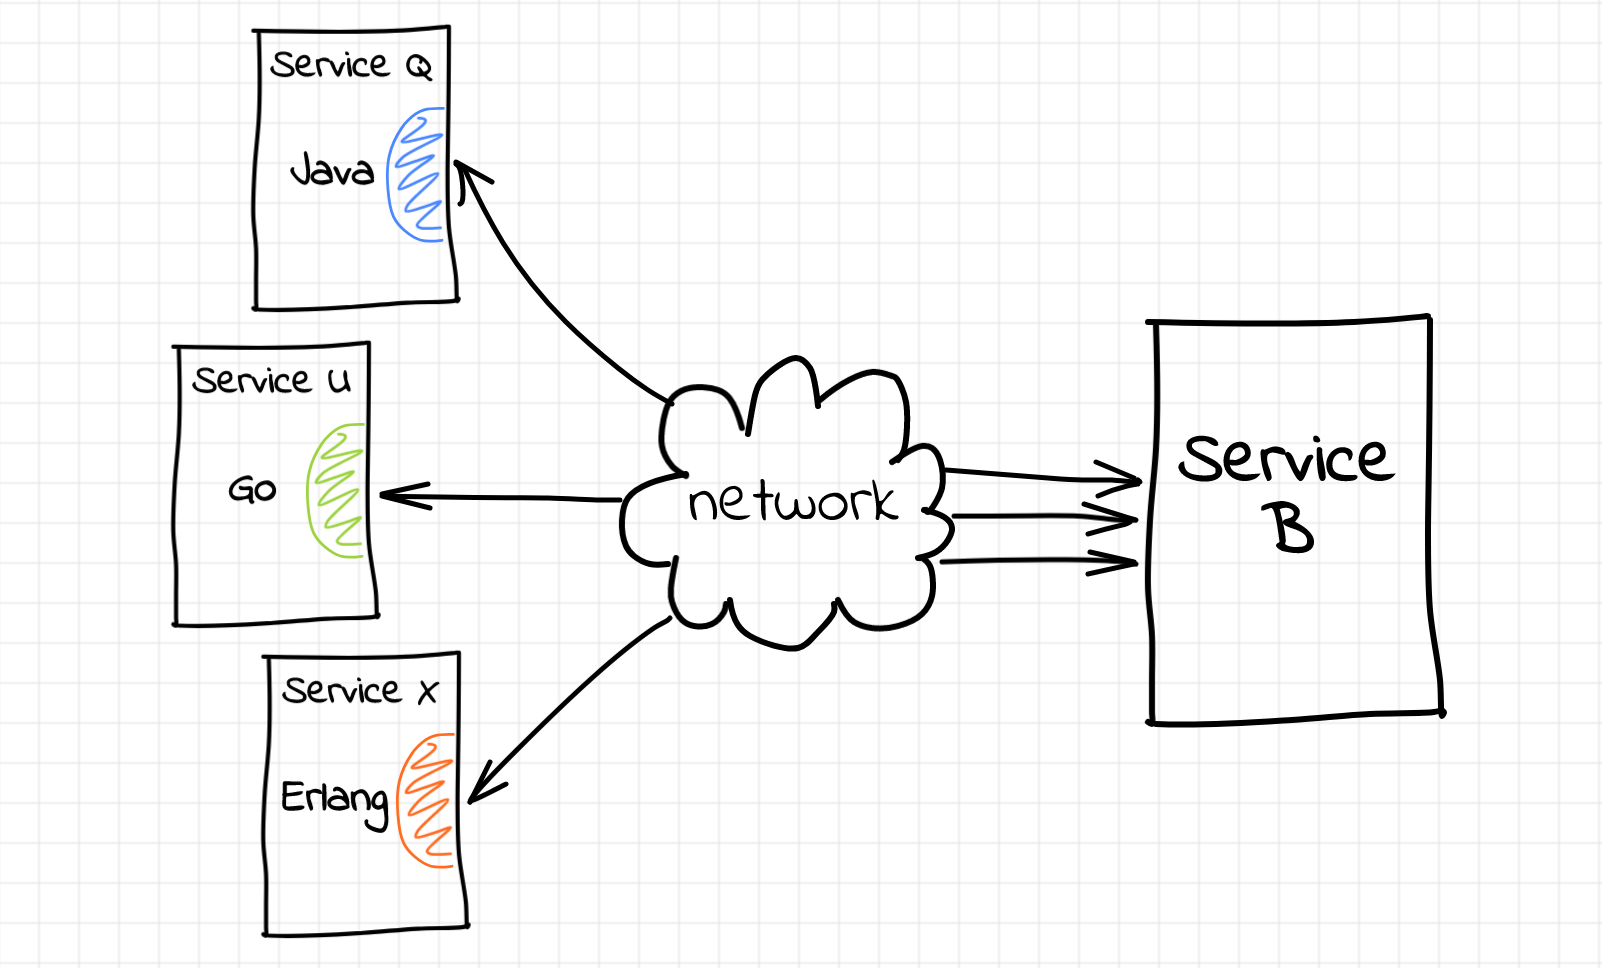
Unfortunately, this simplicity is not always the case. Replace service A with service Z that was written 10 years ago in some esoteric language by a developer that already retired. Or add to the equitation services Q, U, and X written by different teams in three different languages. As a result, the cumulative cost of the company-wide retry mechanism implementation in the code gets really high...
But what if retries are not the only thing you need? Proper request timeouts have to be ensured as well. And how about distributed tracing? It'd be nice to correlate the whole request tree with the original customer transaction by propagating some additional HTTP headers. However, every such capability would make the HTTP libraries even more bloated...
What is a sidecar proxy?
Let's try to go one level higher... or lower? 🤔
In our original setup, service A has been communicating with service B directly. But what if we put an intermediary infrastructure component in between those services? Thanks to containerization, orchestration, devops, add a buzz word of your choice here, nowadays, it became so simple to configure infrastructure, that the cost of adding another infra component is often lower than the cost of writing application code...
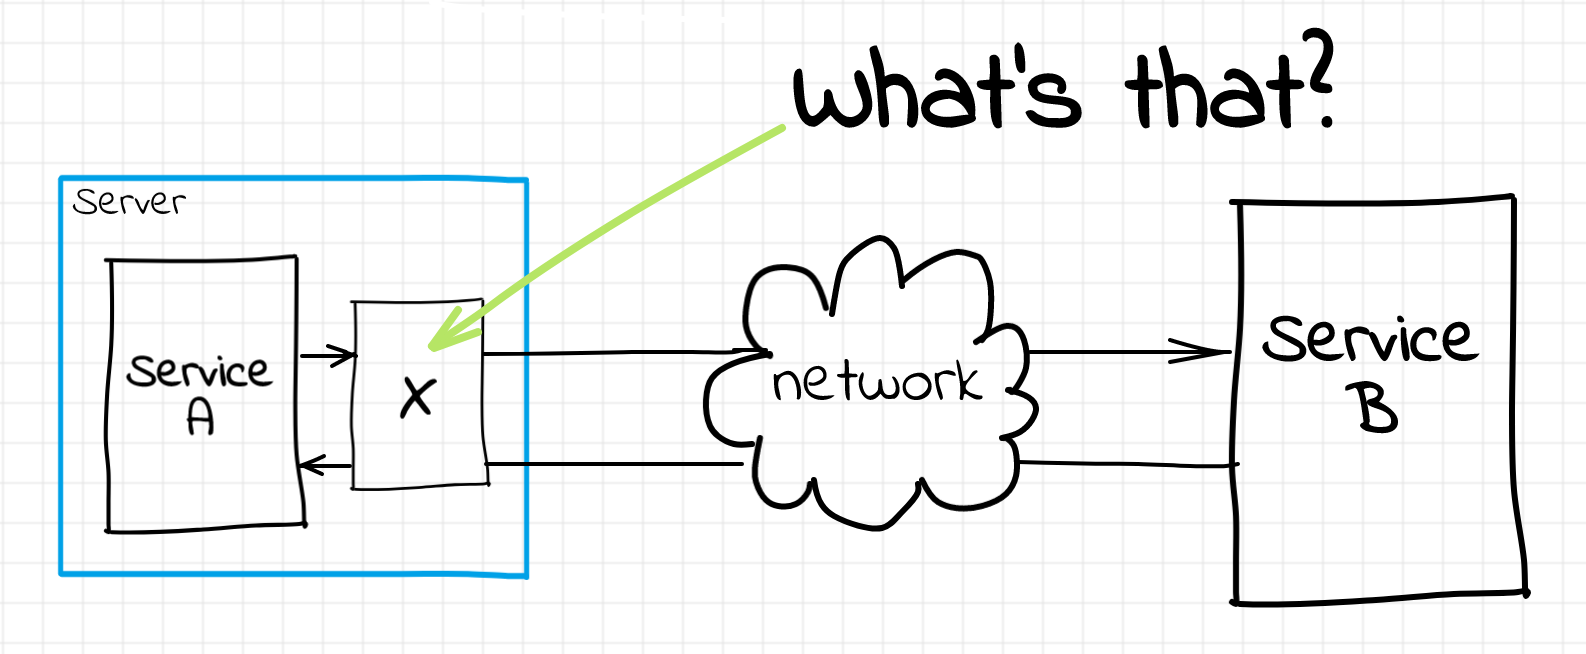
For the sake of simplicity, let's call the box enclosing the service A and the secret intermediary component a server (bare metal or virtual, doesn't really matter). And now it's about time to introduce one of the fancy words from the article's title. Any piece of software running on the server alongside the primary service and helping it do its job is called a sidecar. I hope, the idea behind the name is more or less straightforward here.
But getting back to the service-to-service communication problem, what sidecar should we use to keep the service code free of the low-level details such as retries or request tracing? Well, the needed piece of software is called a service proxy. Probably, the most widely used implementation of the service proxy in the real world is envoy.
The idea of the service proxy is the following: instead of accessing the service B directly, code in the service A now will be sending requests to the service proxy sidecar. Since both of the processes run on the same server, the loopback network interface (i.e. 127.0.0.1 aka localhost) is perfectly suitable for this part of the communication. On every received HTTP request, the service proxy sidecar will make a request to the upstream service using the external network interface of the server. The response from the upstream will be eventually forwarded back by the sidecar to the service A.
I think, at this time, it's already obvious where the retry, timeouts, tracing, etc. logic should reside. Having this kind of functionality provided by a separate sidecar process makes enhancing any service written in any language with such capabilities rather trivial.
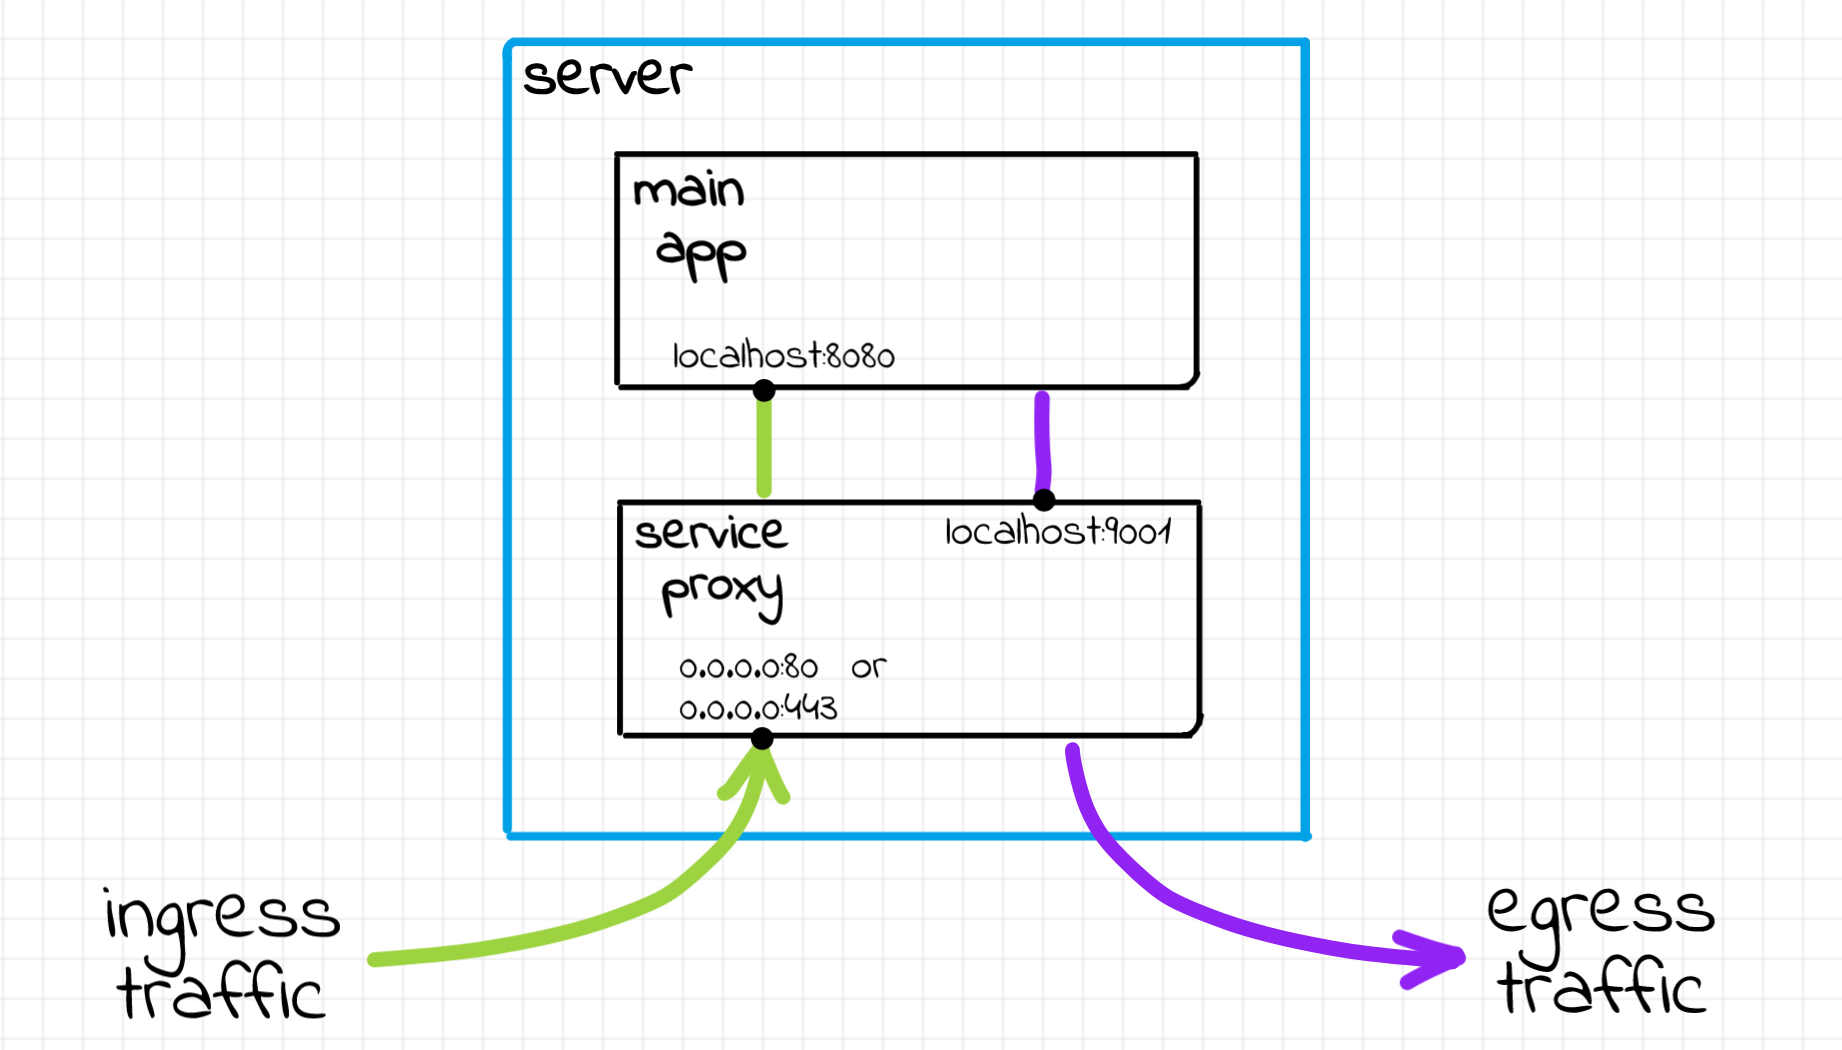
Interestingly enough, that service proxy could be used not only for outgoing traffic (egress) but also for the incoming traffic (ingress) of the service A. Usually, there is plenty of cross-cutting things that can be tackled on the ingress stage. For instance, proxy sidecars can do SSL termination, request authentication, and more. A detailed diagram of a single server setup could look something like that:
Probably, the last fancy term we are going to cover here is a pod. People have been deploying code using virtual machines or bare metal servers for a long time... A server itself is already a good abstraction and a unit of encapsulation. For instance, every server has at least one external network interface, a network loopback interface for the internal IPC needs, and it can run a bunch of processes sharing access to these communication means. Servers are usually addressable within the private network of the company by their IPs. Last but not least, it's pretty common to use a whole server for a single purpose (otherwise, maintenance quickly becomes a nightmare). I.e. you may have a group of identical servers running instances of service A, another group of servers each running an instance of service B, etc. So, why on earth would anybody want something better than a server?
Despite being a good abstraction, the orchestration overhead servers introduce is often too high. So people started thinking about how to package applications more efficiently and that's how we got containers. Well, probably you know that Docker and container had been kind of a synonym for a long time and folks from Docker have been actively advocating for "a one process per container" model. Obviously, this model is pretty different from the widely used server abstraction where multiple processes are allowed to work side by side. And that's how we got the concept of pods. A pod is just a group of containers sharing a bunch of namespaces. If we now run a single process per container all of the processes in the pod will still share the common execution environment. In particular, the network namespace. Thus, all the containers in the pod will have a shared loopback interface and a shared external interface with an IP address assigned to it. Then it's up to the orchestration layer (say hi to Kubernetes) how to make all the pods reachable within the network by their IPs. And that's how people reinvented servers...
So, getting back to all those blue boxes enclosing the service process and the sidecar on the diagrams above - we can think of them as being either a virtual machine, a bare metal server, or a pod. All three of them are more or less interchangeable abstractions.
To summarize, let's try to visualize how the service to service communication could look like with the proxy sidecars:
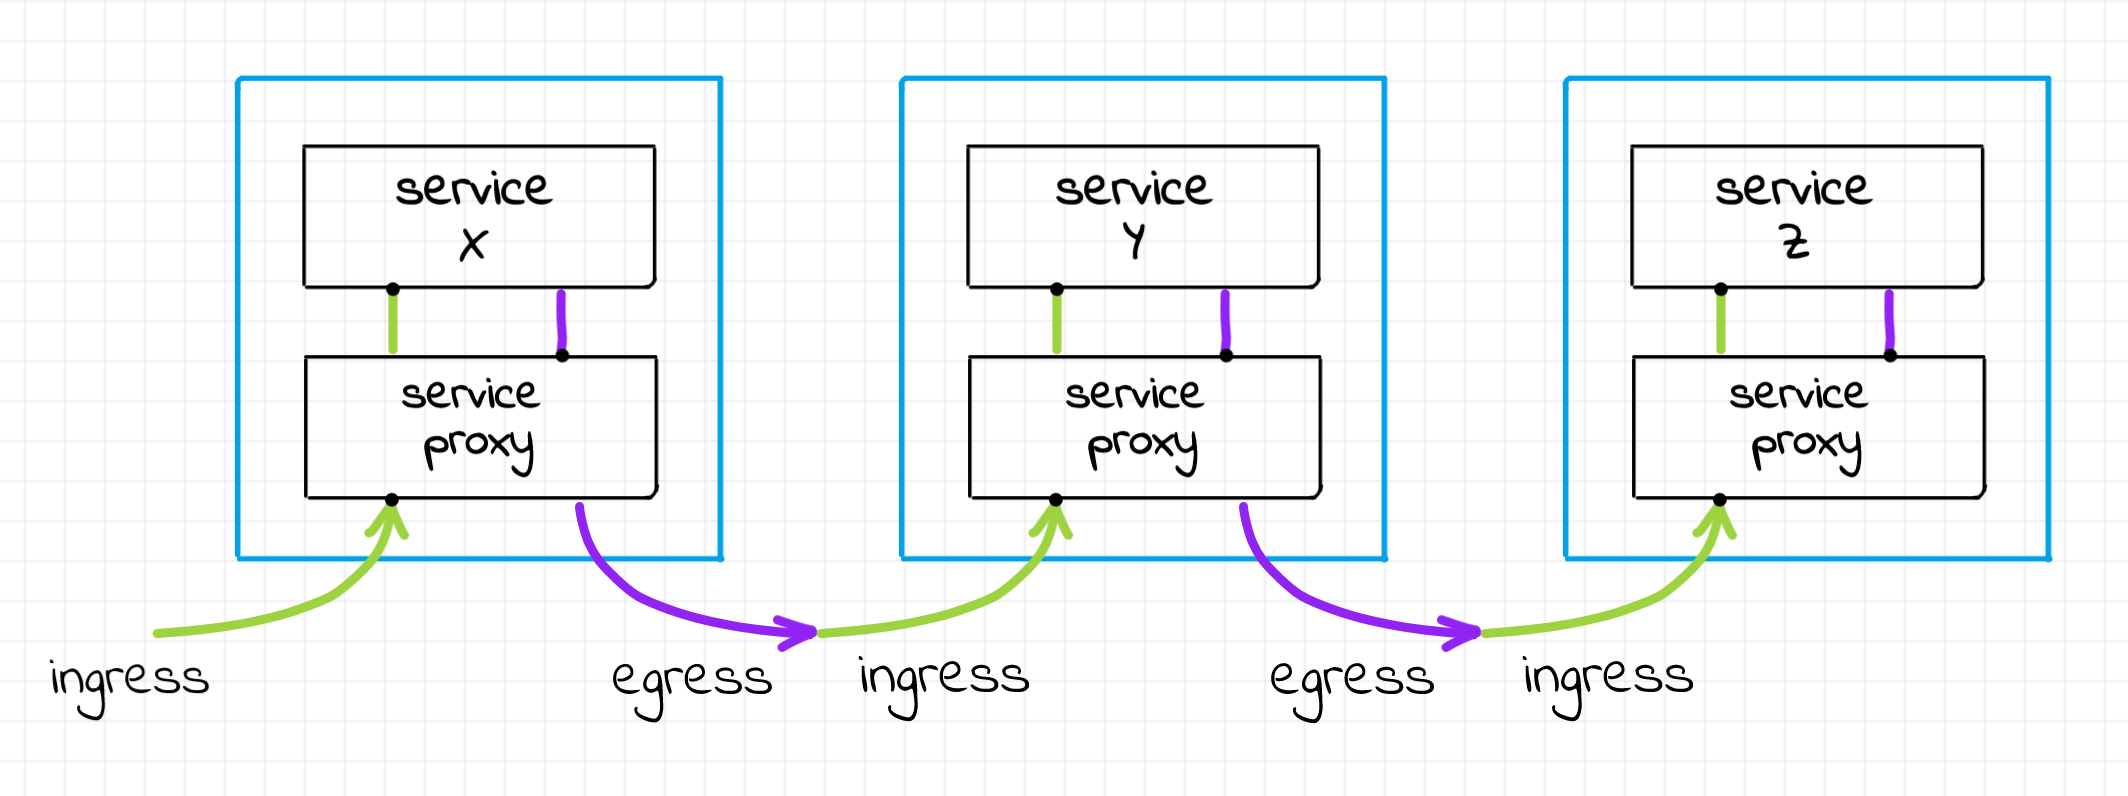
Example of service to service communication topology, a.k.a. service mesh.
Sidecar proxy example (practical part)
Since the only way to really understand something is to write a blog post about it implement it yourself, let's quickly hack a demo environment.
Service A talks to service B directly
We will start from the simple setup where service A will be accessing service B directly:
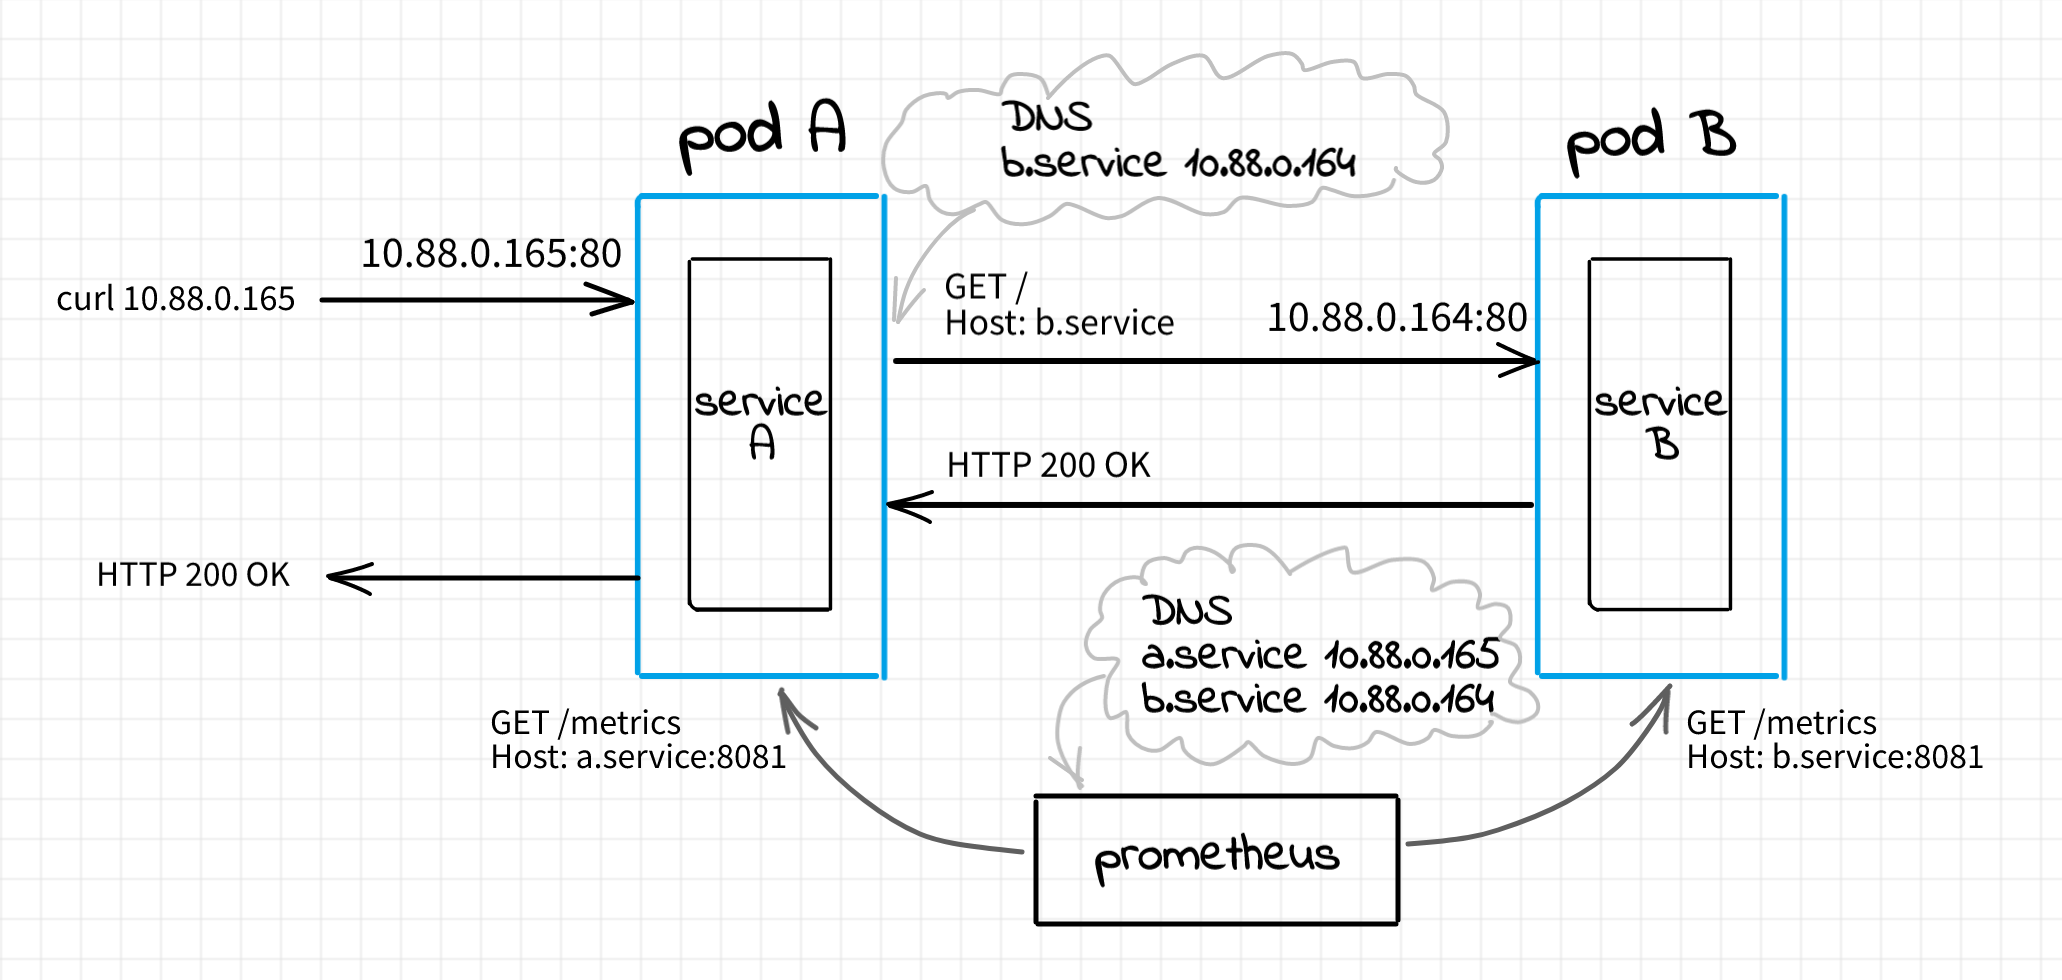
The code of the service A is relatively straightforward. It's just a simple HTTP server that makes a call to its upstream service B on every client request. Depending on the response from the upstream, A returns either an HTTP 200 or HTTP 500 to the client.
package main

// ...

var requestCounter = prometheus.NewCounterVec(
    prometheus.CounterOpts{
        Name: "service_a_requests_total",
        Help: "The total number of requests received by Service A.",
    },
    []string{"status"},
)

func handler(w http.ResponseWriter, r *http.Request) {
    resp, err := httpGet(os.Getenv("UPSTREAM_SERVICE"))
    if err == nil {
        fmt.Fprintln(w, "Service A: upstream responded with:", resp)
        requestCounter.WithLabelValues("2xx").Inc()
    } else {
        http.Error(w, fmt.Sprintf("Service A: upstream failed with: %v", err.Error()),
            http.StatusInternalServerError)
        requestCounter.WithLabelValues("5xx").Inc()
    }
}

func main() {
    // init prometheus /metrics endpoint

    http.HandleFunc("/", handler)
    log.Fatal(http.ListenAndServe(
        os.Getenv("SERVICE_HOST")+":"+os.Getenv("SERVICE_PORT"), nil))
}
(see full version on GitHub)
Notice that instead of hard-coding, we use SERVICE_HOST and SERVICE_PORT env variables to specify the host and port of the HTTP API endpoint. It'll come in handy soon. Additionally, the code of the service relies on the UPSTREAM_SERVICE env variable when accessing the upstream service B.
To get some visibility, the code is instrumented with the primitive counter metric service_a_requests_total that gets incremented on every incoming request. We will use an instance of prometheus service to scrape the metrics exposed by the service A.
The implementation of the upstream service B is trivial as well. It's yet another HTTP server. However its behavior is rather close to a static endpoint.
package main

// ...

var ERROR_RATE int

var (
    requestCounter = prometheus.NewCounterVec(
        prometheus.CounterOpts{
            Name: "service_b_requests_total",
            Help: "The total number of requests received by Service B.",
        },
        []string{"status"},
    )
)

func handler(w http.ResponseWriter, r *http.Request) {
    if rand.Intn(100) >= ERROR_RATE {
        fmt.Fprintln(w, "Service B: Yay! nounce", rand.Uint32())
        requestCounter.WithLabelValues("2xx").Inc()
    } else {
        http.Error(w, fmt.Sprintf("Service B: Ooops... nounce %v", rand.Uint32()),
            http.StatusInternalServerError)
        requestCounter.WithLabelValues("5xx").Inc()
    }
}

func main() {
    // set ERROR_RATE
    // init prometheus /metrics endpoint

    http.HandleFunc("/", handler)

    // Listen on all interfaces
    log.Fatal(http.ListenAndServe(":"+os.Getenv("SERVICE_PORT"), nil))
}
(see full version on GitHub)
Probably the only interesting part here is ERROR_RATE. The service is designed to fail requests with some constant rate, i.e. if ERROR_RATE is 20, approximately 20% of requests will fail with HTTP 500 status code. As with the service A, we will use prometheus to scrape basic usage statistics, see the counter service_b_requests_total.
Now it's time to launch the services and wire them up together. We are going to use podman to build and run services. Mostly because unlike Docker, podman supports the concept of pods out of the box. Heck, look at its name, it's PODman 🐵
We will start from creating the service B since it's a dependency of the service A. Clone the demo repository and run the following commands from its root (a Linux host with installed podman is assumed):
Click here to see service B Dockerfile.
FROM golang:1.15

# Build
ENV GO111MODULE=on

WORKDIR /app

COPY go.mod .
COPY main.go .

RUN go mod download
RUN go build -o service-b

# Run
ENV ERROR_RATE=30

ENV SERVICE_PORT=80

ENV METRICS_PORT=8081

CMD ["/app/service-b"]
# Build service B image
$ sudo podman build -t service-b -f service-b/Dockerfile

# Create a pod (read "server") for service B
$ sudo podman pod create --name service-b-pod

# Start service B container in the pod
$ sudo podman run --name service-b -d --rm --pod service-b-pod \
    -e ERROR_RATE=20 service-b

# Keep pod's IP address for future use
$ POD_B_IP=$(sudo podman inspect -f "{{.NetworkSettings.IPAddress}}" \
    $(sudo podman pod inspect -f "{{.InfraContainerID}}" service-b-pod))

$ echo $POD_B_IP
> 10.88.0.164  # output on my machine
Notice that the server is listening on pod's external network interface, port 80:
$ curl $POD_B_IP
> Service B: Yay! nounce 3494557023
$ curl $POD_B_IP
> Service B: Yay! nounce 1634910179
$ curl $POD_B_IP
> Service B: Yay! nounce 2013866549
$ curl $POD_B_IP
> Service B: Ooops... nounce 1258862891
Now we are ready to proceed with the service A. First, let's create a pod:
# Create a pod (read "server") for service A
$ sudo podman pod create --name service-a-pod \
    --add-host b.service:$POD_B_IP --publish 8080:80
Notice how we injected a DNS record like b.service 10.88.0.164. Since both pods reside in the same podman network, they can reach each other using assigned IP addresses. However, as of the time of writing this, podman doesn't provide DNS support for pods (yet). So, we have to maintain the mappings manually. Of course, we could use the plain IP address of the B's pod while accessing the upstream from the service A code. However, it's always nice to have human-readable hostnames instead of raw IP addresses. We will also see how this technique comes in handy with the envoy proxy sidecar below.
Let's continue with the service itself. We need to build it and run inside the pod we've just created.
Click here to see service A Dockerfile.
FROM golang:1.15

# Build
ENV GO111MODULE=on

WORKDIR /app

COPY go.mod .
COPY main.go .

RUN go mod download
RUN go build -o service-a

# Run
ENV SERVICE_HOST="0.0.0.0"
ENV SERVICE_PORT=80

ENV METRICS_HOST="0.0.0.0"
ENV METRICS_PORT=8081

ENV UPSTREAM_SERVICE="http://b.service/"

CMD ["/app/service-a"]
# Build service A image
$ sudo podman build -t service-a -f service-a/Dockerfile-service

# Start service A container in the pod
$ sudo podman run --name service-a -d --rm --pod service-a-pod \
   -e SERVICE_HOST=0.0.0.0 -e SERVICE_PORT=80 \
   -e UPSTREAM_SERVICE=http://b.service:80 \
   service-a

# Keep pod's IP address for future use
$ POD_A_IP=$(sudo podman inspect -f "{{.NetworkSettings.IPAddress}}" \
    $(sudo podman pod inspect -f "{{.InfraContainerID}}" service-a-pod))

$ echo $POD_A_IP
> 10.88.0.165  # output on my machine
Remember the diagram from the beginning of this section. At this part of the exercise service A has to be directly exposed to the outside world (i.e. the host machine) and it has to communicate with the service B directly as well. That's why we made service A listening on the pod's external network interface using -e SERVICE_HOST=0.0.0.0 -e SERVICE_PORT=80 and provided it with the knowledge how to reach the service B -e UPSTREAM_SERVICE=http://b.service:80.
The last preparation before pouring some traffic - starting a prometheus node:
# Scrape configs
$ cat prometheus/prometheus.yml
> scrape_configs:
>   - job_name: service-a
>     scrape_interval: 1s
>     static_configs:
>       - targets: ['a.service:8081']
>
>   - job_name: service-b
>     scrape_interval: 1s
>     static_configs:
>       - targets: ['b.service:8081']

# Dockerfile
$ cat prometheus/Dockerfile
> FROM prom/prometheus:v2.20.1
> COPY prometheus.yml /etc/prometheus/prometheus.yml

# Build & run
$ sudo podman build -t envoy-prom -f prometheus/Dockerfile

$ sudo podman run --name envoy-prom -d --rm \
   --publish 9090:9090 \
   --add-host a.service:$POD_A_IP \
   --add-host b.service:$POD_B_IP \
   envoy-prom
At this time, we have two services within a shared network. They can talk to each other using their IP addresses. Additionally, port 80 of the service A is mapped to the port 8080 of the host machine and prometheus is exposed on the port 9090. I intentionally made these two ports mapped on 0.0.0.0 'cause I run the demo inside a VirtualBox machine. This way, I can access prometheus graphical interface from the laptop's host operating system via using <vm_ip_address>:9090/graph.
Finally, we can send some traffic to the service A and see what happens:
$ for _ in {1..1000}; do curl --silent localhost:8080; done | sort | uniq -w 24 -c
>    1000
>     208 Service A: upstream failed with: HTTP 500 - Service B: Ooops... nounce 1007409508
>     792 Service A: upstream responded with: Service B: Yay! nounce 1008262846
Yay! 🎉 As expected, ca. 20% of the upstream requests failed with the HTTP 500 status code. Let's take a look at the prometheus metrics to see the per-service statistics:

service_a_requests_total
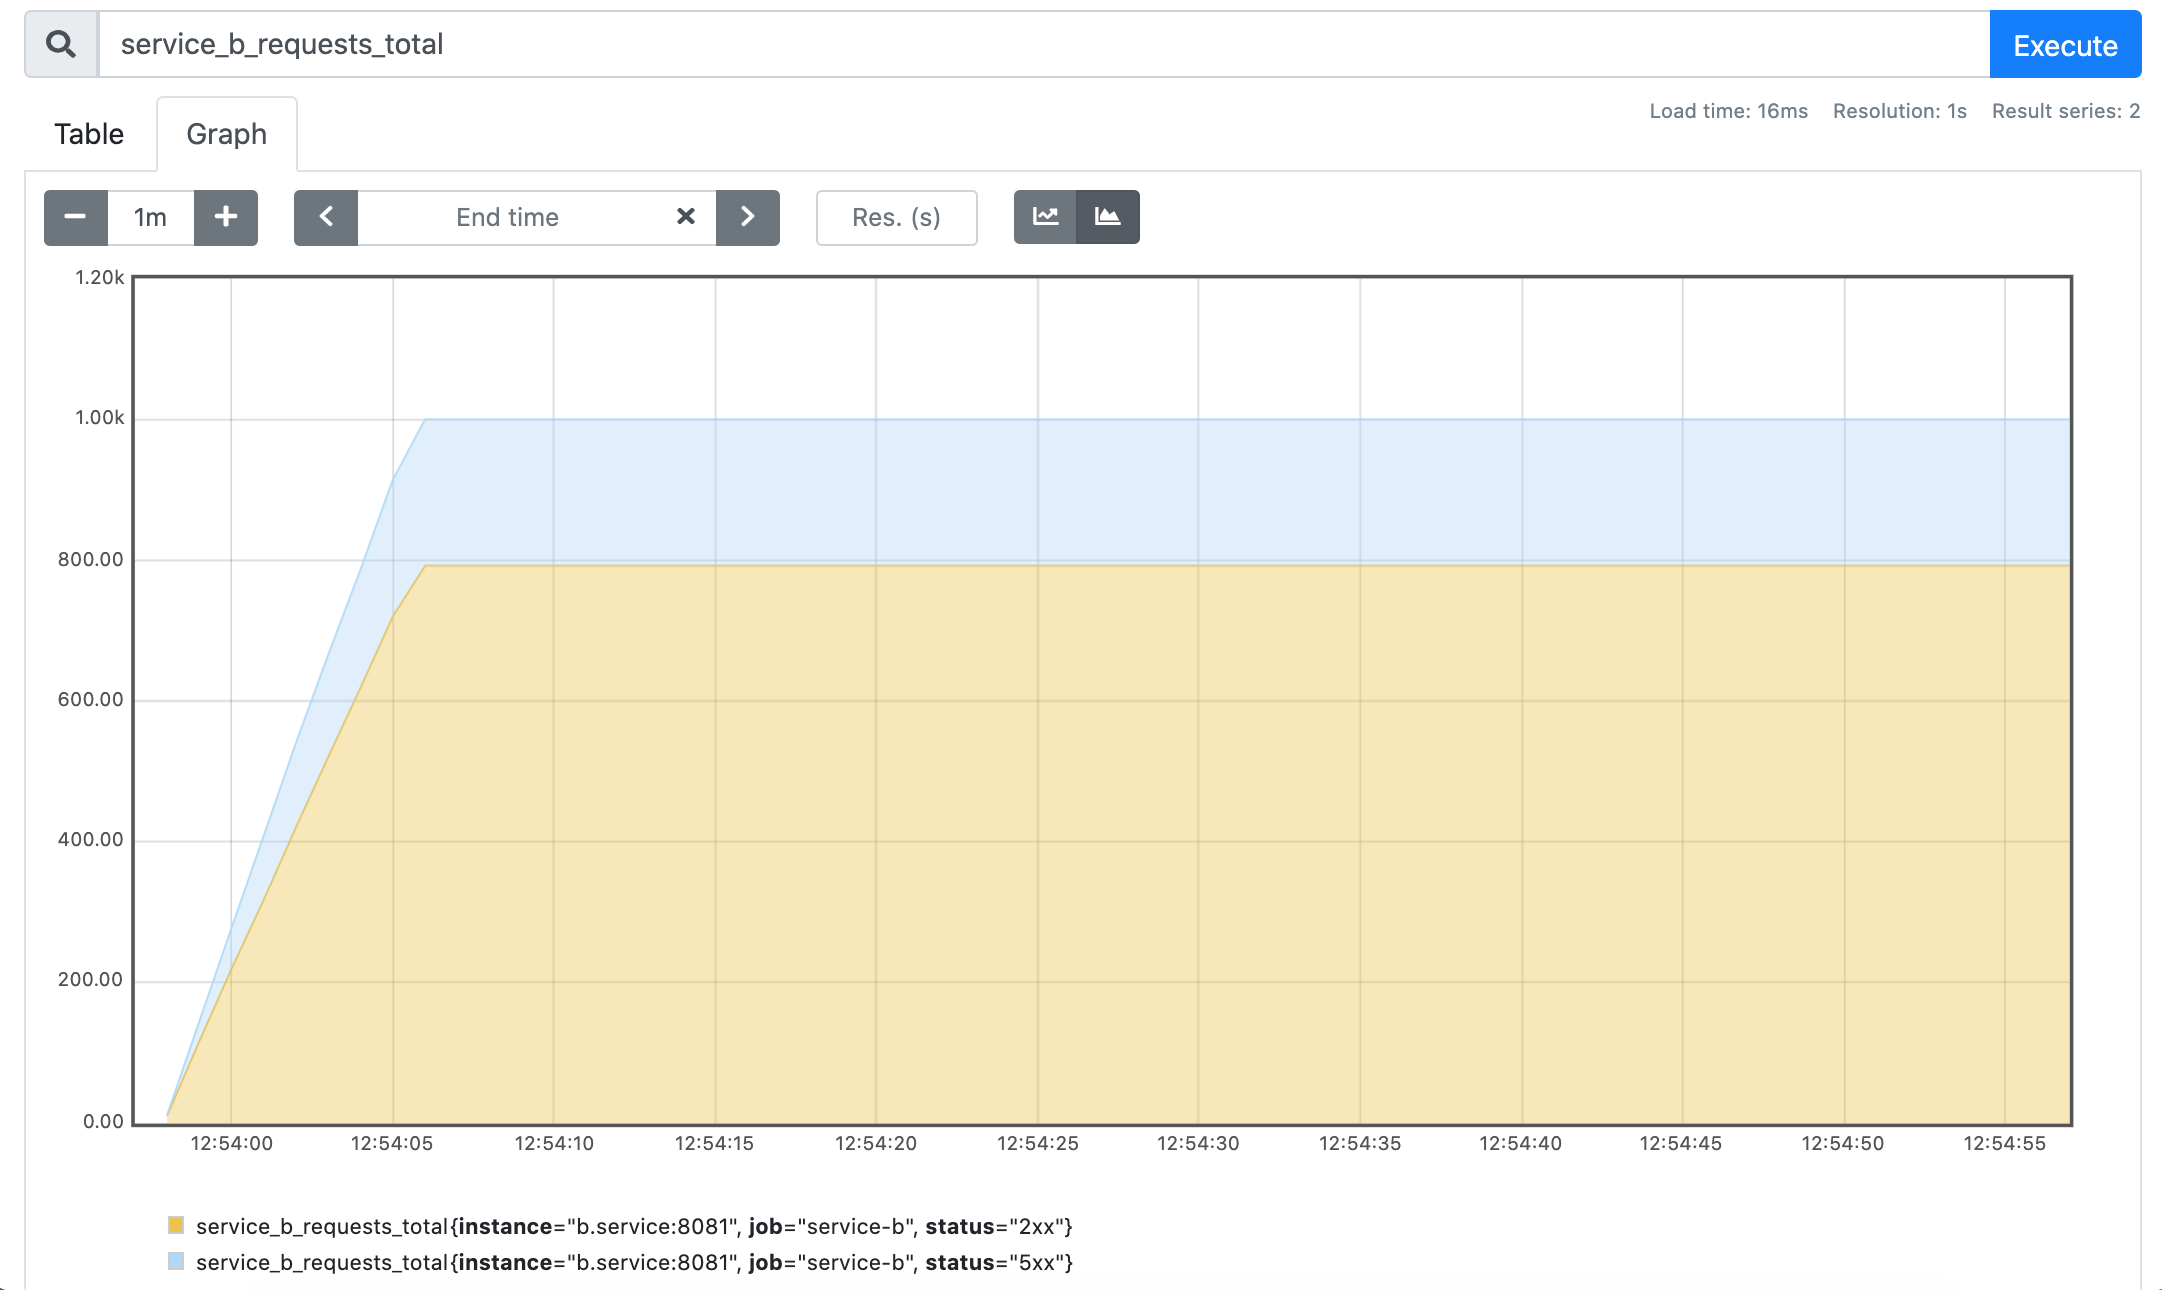
service_b_requests_total
Well, I believe it's not a surprise that both services handled each 1000 of requests and the service A failed as many requests as the service B.
Service A talks to service B through envoy proxy sidecar
Let's enhance our setup by adding a service proxy sidecar to the service A. For the sake of simplicity of this demo, the only thing the sidecar will be doing is making up to 2 retries of the failed HTTP requests. Hopefully, it'll improve the overall service A success rate. The desired setup will look as follows:
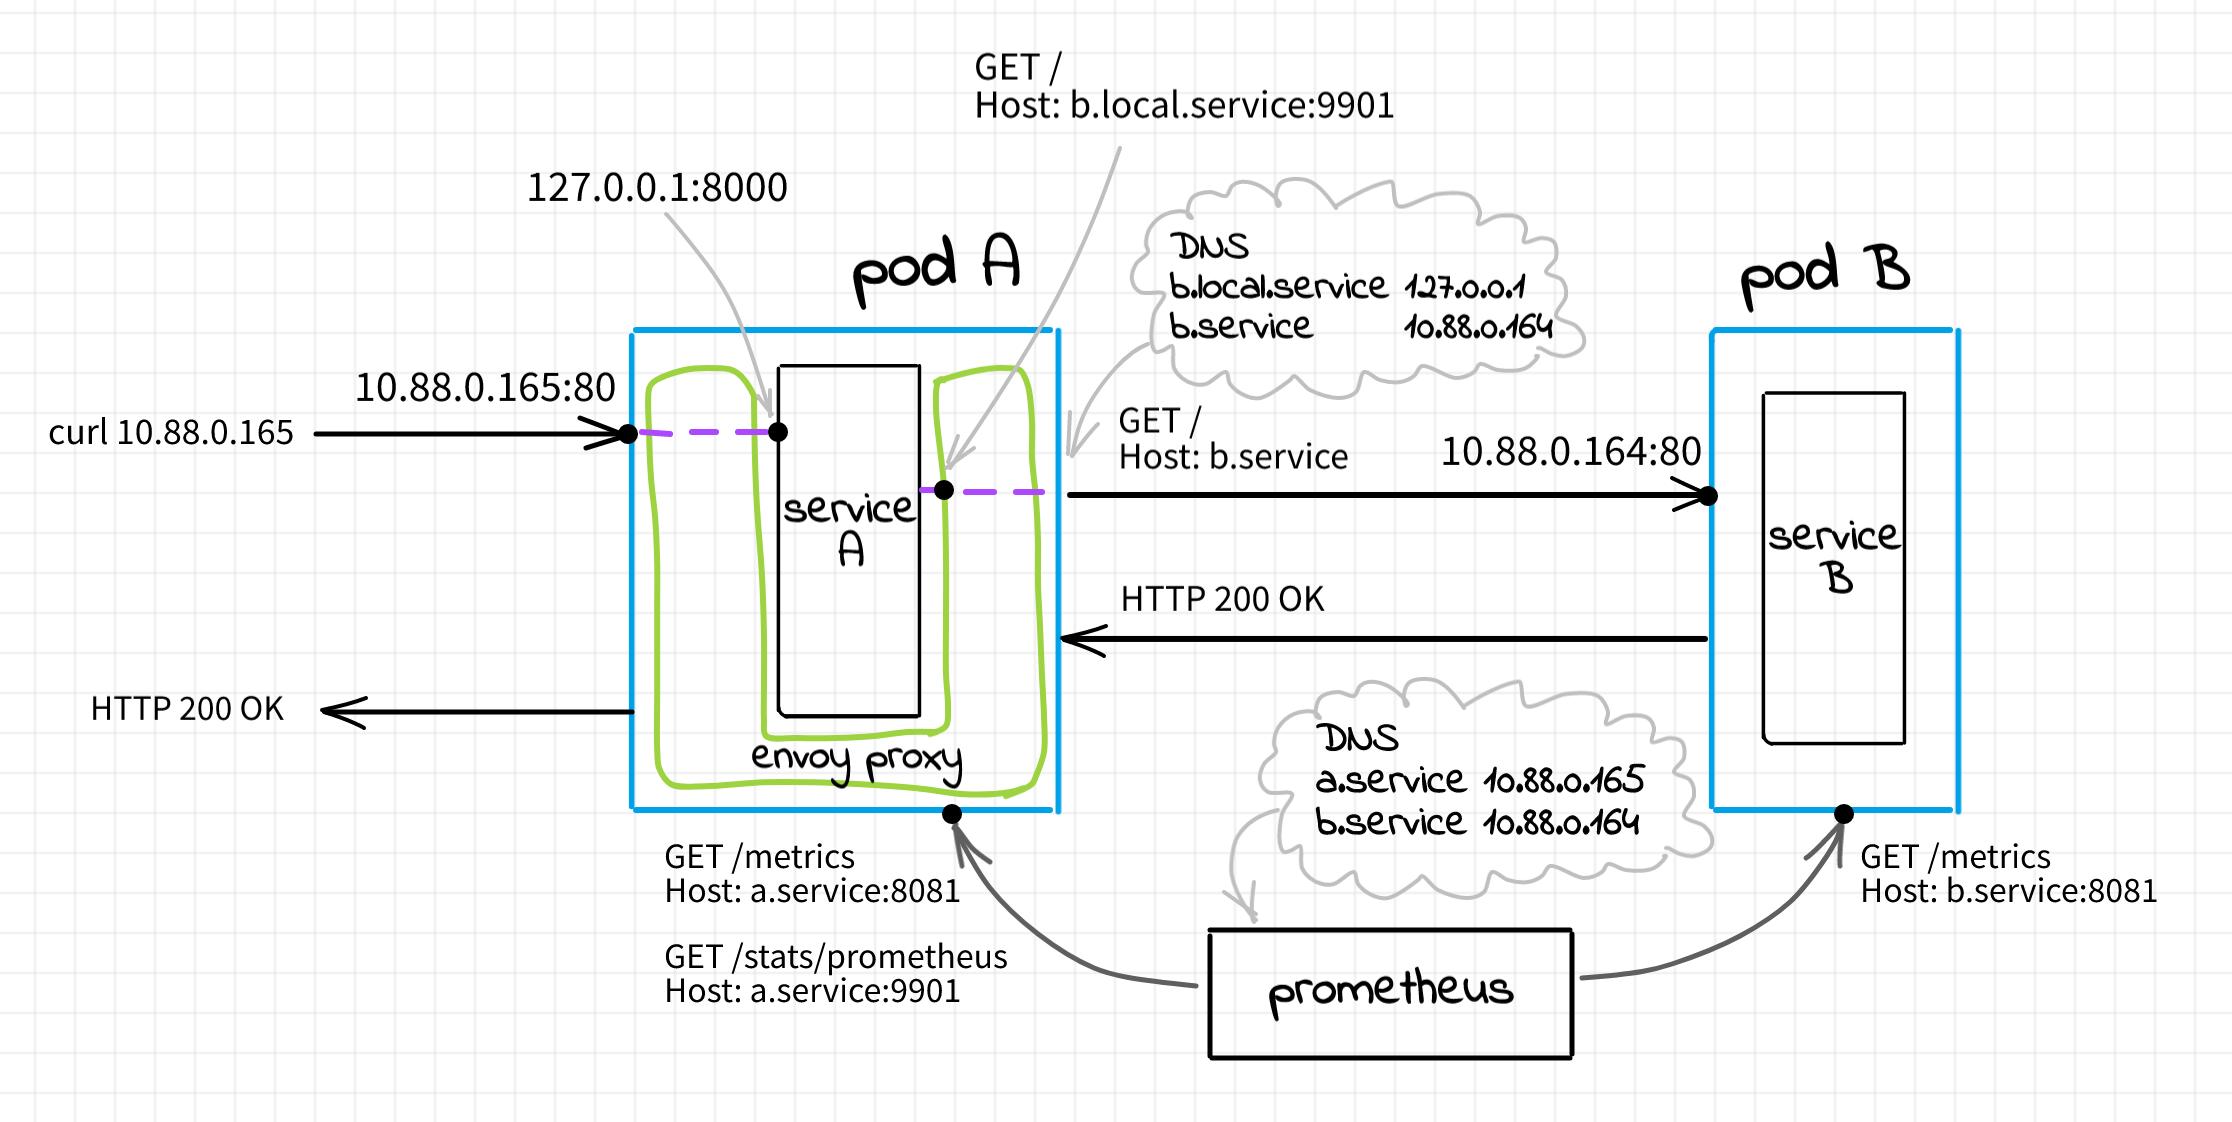
The main difference is that with the sidecar all incoming and outgoing requests will be passing through envoy. In contrast with the previous section setup, service A will neither be exposed publicly nor will be allowed to contact service B directly.
Let's review two scenarios:
Ingress: a client sends an HTTP request to
$POD_A_IP. It hits the envoy sidecar listening on$POD_A_IP:80. Envoy, in turn, makes a request to the service A container listening on the pod'slocalhost:8000. Once the envoy process gets the response from the service A container, it forwards it back to the client.Egress: service A gets a request from envoy. To handle it, the service process needs to access the upstream service B. The service A container sends a request to another envoy listener sitting on pod's
localhost:9001. Additionally, service A specifies the HTTP Host headerb.local.serviceallowing envoy to route this request appropriately. When envoy receives a request onlocalhost:9001it knows that it's egress traffic. It checks the Host header and if it looks like the service B, it makes a request to$POD_B_IP.
Configuring envoy could quickly become tricky due to its huge set of capabilities. However, the official documentation is a great place to start. It not only describes the configuration format but also highlights some best practices and explains some concepts. In particular, I suggest these two articles "Life of a Request" and "Service to service only" for a better understanding of the material.
From a very high-level overview, Envoy could be seen as a bunch of pipelines. A pipeline starts from the listener and then connected through a set of filters to some number of clusters, where a cluster is just a logical group of network endpoints. Trying to be less abstract:
# Ingress
listener 0.0.0.0:80
       |
http_connection_manager (filter)
       |
http_router (filter)
       |
local_service (cluster) [127.0.0.1:8000]

# Egress
listener 127.0.0.1:9001
       |
http_connection_manager (filter)
       |
http_router (filter)
       |
remote_service_b (cluster) [b.service:80]
Click here to see envoy.yaml file.
static_resources:
  listeners:
  # Ingress
  - address:
      socket_address:
        address: 0.0.0.0
        port_value: 80
    filter_chains:
    - filters:
      - name: envoy.filters.network.http_connection_manager
        typed_config:
          "@type": type.googleapis.com/envoy.config.filter.network.http_connection_manager.v2.HttpConnectionManager
          codec_type: auto
          stat_prefix: ingress_http
          access_log:
          - name: envoy.access_loggers.file
            typed_config:
              "@type": type.googleapis.com/envoy.config.accesslog.v2.FileAccessLog
              path: /dev/stdout
          route_config:
            name: ingress_route
            virtual_hosts:
            - name: local_service
              domains:
              - "*"
              routes:
              - match:
                  prefix: "/"
                route:
                  cluster: local_service
          http_filters:
          - name: envoy.filters.http.router
            typed_config: {}
  # Egress
  - address:
      socket_address:
        address: 127.0.0.1
        port_value: 9001
    filter_chains:
    - filters:
      - name: envoy.filters.network.http_connection_manager
        typed_config:
          "@type": type.googleapis.com/envoy.config.filter.network.http_connection_manager.v2.HttpConnectionManager
          codec_type: auto
          stat_prefix: egress_http
          access_log:
          - name: envoy.access_loggers.file
            typed_config:
              "@type": type.googleapis.com/envoy.config.accesslog.v2.FileAccessLog
              path: /dev/stdout
          route_config:
            name: egress_route
            virtual_hosts:
            - name: remote_service_b
              domains:
              - "b.local.service"
              - "b.local.service:*"
              retry_policy:
                retry_on: 5xx
                num_retries: 2
              routes:
              - match:
                  prefix: "/"
                route:
                  cluster: remote_service_b
          http_filters:
          - name: envoy.filters.http.router
            typed_config: {}

  clusters:
  - name: local_service
    connect_timeout: 0.25s
    type: strict_dns
    lb_policy: round_robin
    load_assignment:
      cluster_name: local_service
      endpoints:
      - lb_endpoints:
        - endpoint:
            address:
              socket_address:
                address: 127.0.0.1
                port_value: 8000
  - name: remote_service_b
    connect_timeout: 0.25s
    type: strict_dns
    lb_policy: round_robin
    load_assignment:
      cluster_name: remote_service_b
      endpoints:
      - lb_endpoints:
        - endpoint:
            address:
              socket_address:
                address: b.service
                port_value: 80

admin:
  access_log_path: "/dev/stdout"
  address:
    socket_address:
      # Beware: it's insecure to expose admin interface publicly
      address: 0.0.0.0
      port_value: 9901
Envoy is famous for its observability capabilities. It exposes various statistic information and luckily for us, it supports the prometheus metrics format out of the box. We can extend the prometheus scrape configs adding the following section:
# prometheus/prometheus.yml

  - job_name: service-a-envoy
    scrape_interval: 1s
    metrics_path: /stats/prometheus
    static_configs:
      - targets: ['a.service:9901']
To build the envoy sidecar image we can run:
$ sudo podman build -t service-a-envoy -f service-a/Dockerfile-envoy
We don't need to rebuild service images since they've been made configurable via environment variables. However, we need to recreate the service A to make it listening on the pod's localhost:8000.
# Stop existing container and remove pod
$ sudo podman kill service-a
$ sudo podman pod rm service-a-pod

$ sudo podman pod create --name service-a-pod \
   --add-host b.local.service:127.0.0.1 \
   --add-host b.service:$POD_B_IP \
   --publish 8080:80

$ sudo podman run --name service-a -d --rm --pod service-a-pod \
   -e SERVICE_HOST=127.0.0.1 \
   -e SERVICE_PORT=8000 \
   -e UPSTREAM_SERVICE=http://b.local.service:9001 \
   service-a

$ sudo podman run --name service-a-envoy -d --rm --pod service-a-pod \
   -e ENVOY_UID=0 -e ENVOY_GID=0 service-a-envoy

$ POD_A_IP=$(sudo podman inspect -f "{{.NetworkSettings.IPAddress}}" \
    $(sudo podman pod inspect -f "{{.InfraContainerID}}" service-a-pod))
Let's see what happens if we pour some more traffic:
$ for _ in {1..1000}; do curl --silent localhost:8080; done | sort | uniq -w 24 -c
>    1000
>       9 Service A: upstream failed with: HTTP 500 - Service B: Ooops... nounce 1263663296
>     991 Service A: upstream responded with: Service B: Yay! nounce 1003014939
Hooray! 🎉 Seems like the success rate of the service A jumped from 80% to 99%! Well, that's great, but also as expected. The original probability to get HTTP 500 from the service A was equal to the probability of the service B to fail a request since the network conditions are kind of ideal here. But since the introduction of the envoy sidecar, service A got a superpower of retries. The probability to fail 3 consequent requests with a 20% chance of a single attempt failure is 0.2 * 0.2 * 0.2 = 0.008, i.e very close to 1%. Thus, we theoretically confirmed the observed 99% success rate.
Last but not least, let's check out the metrics. We will start from the familiar service_a_requests_total counter:
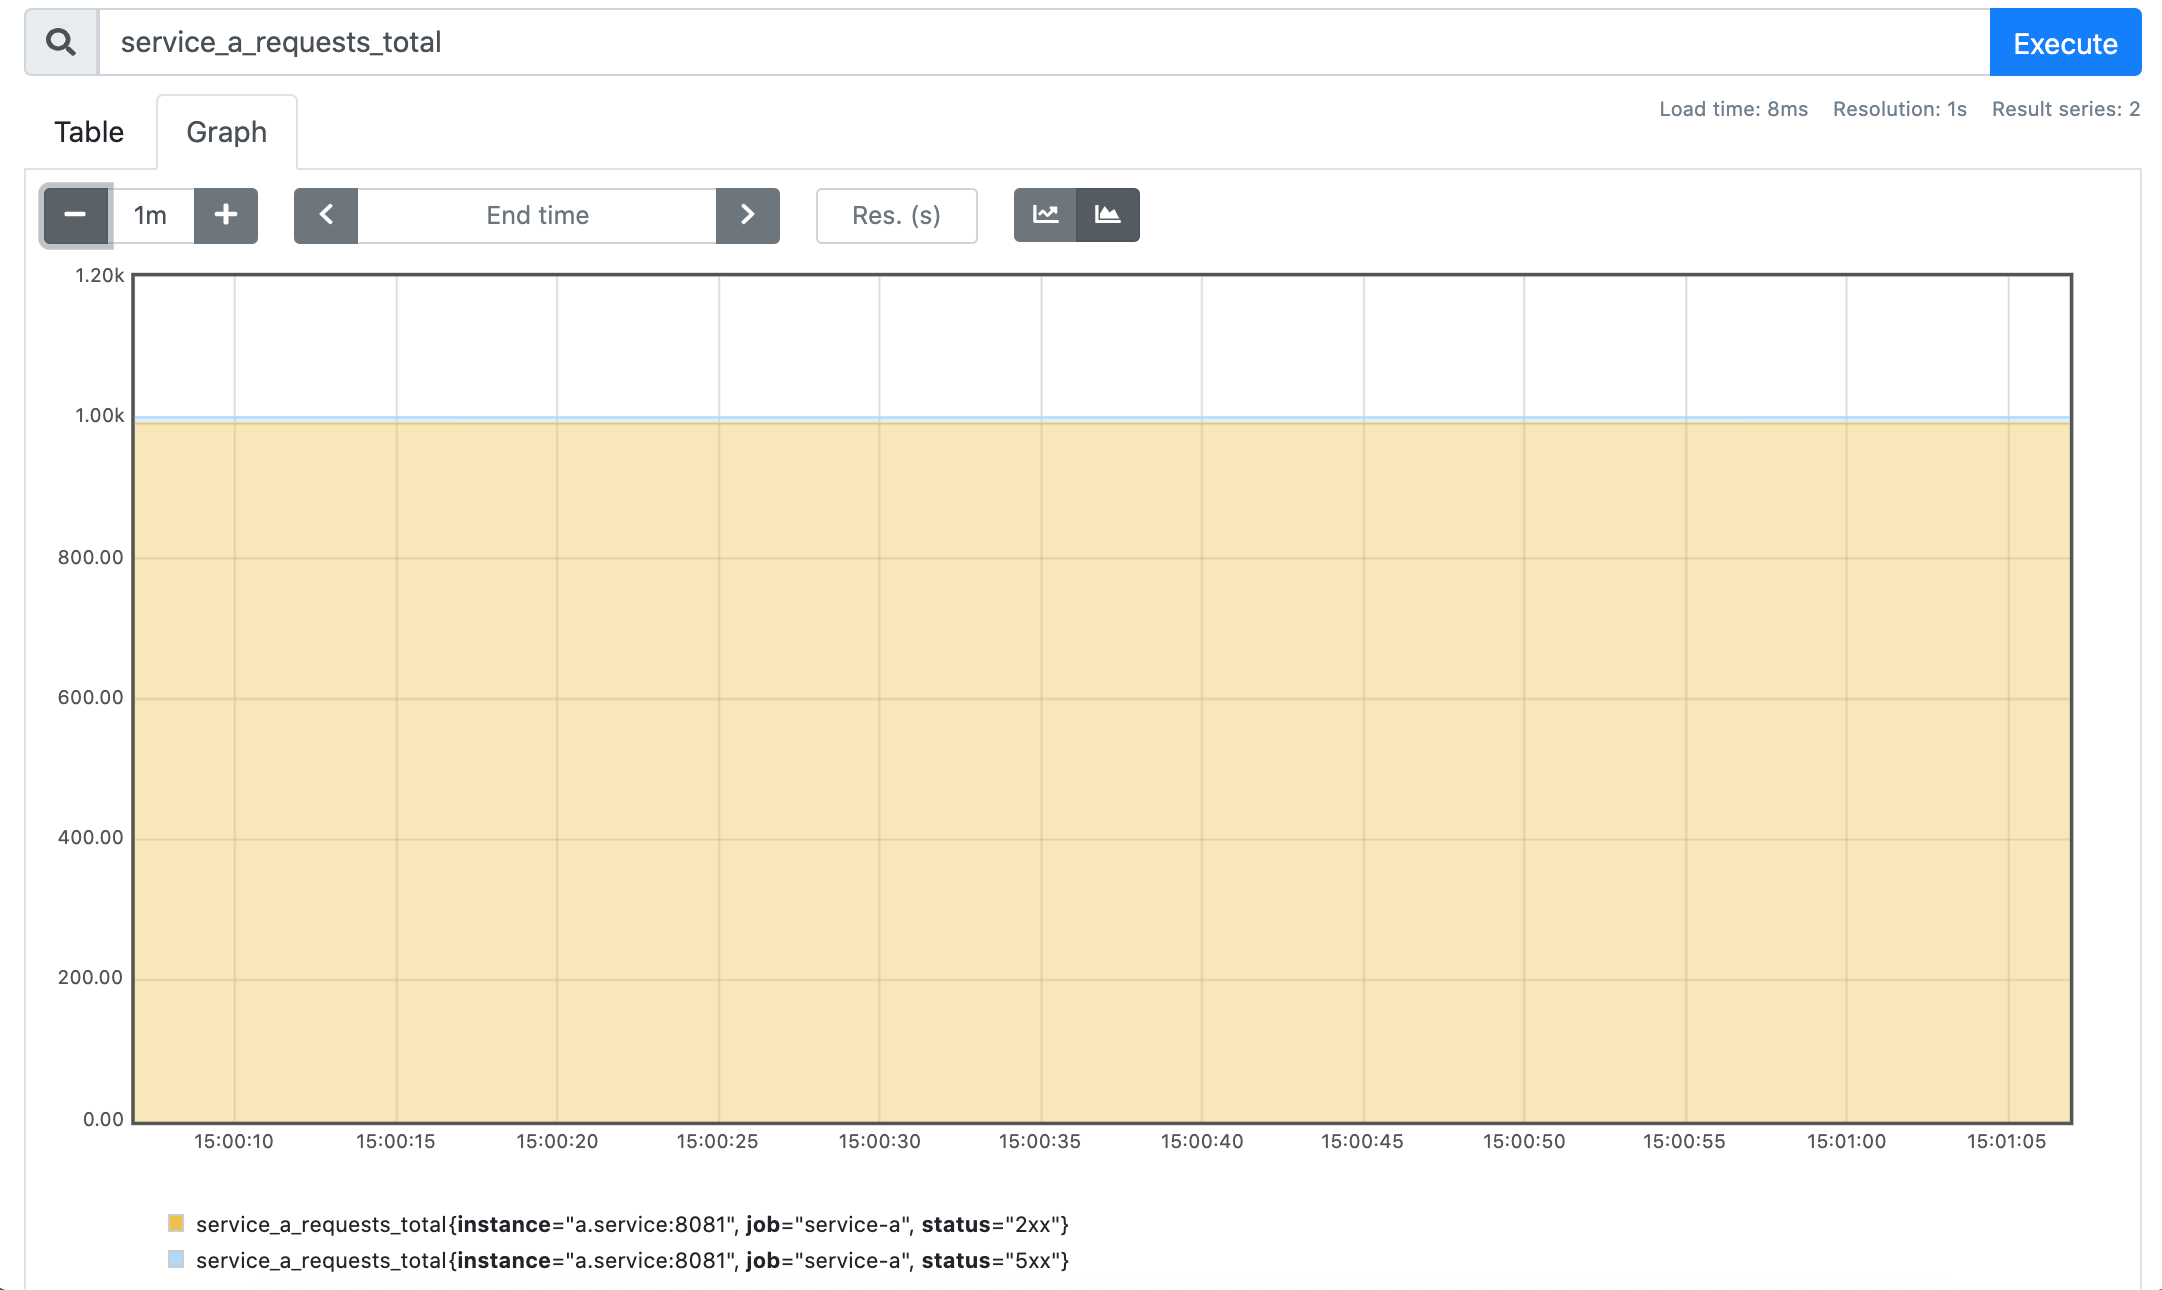
service_a_requests_total
Well, seems like service A again got 1000 requests, but this time it failed only a tiny fraction of it. What's up with service B?
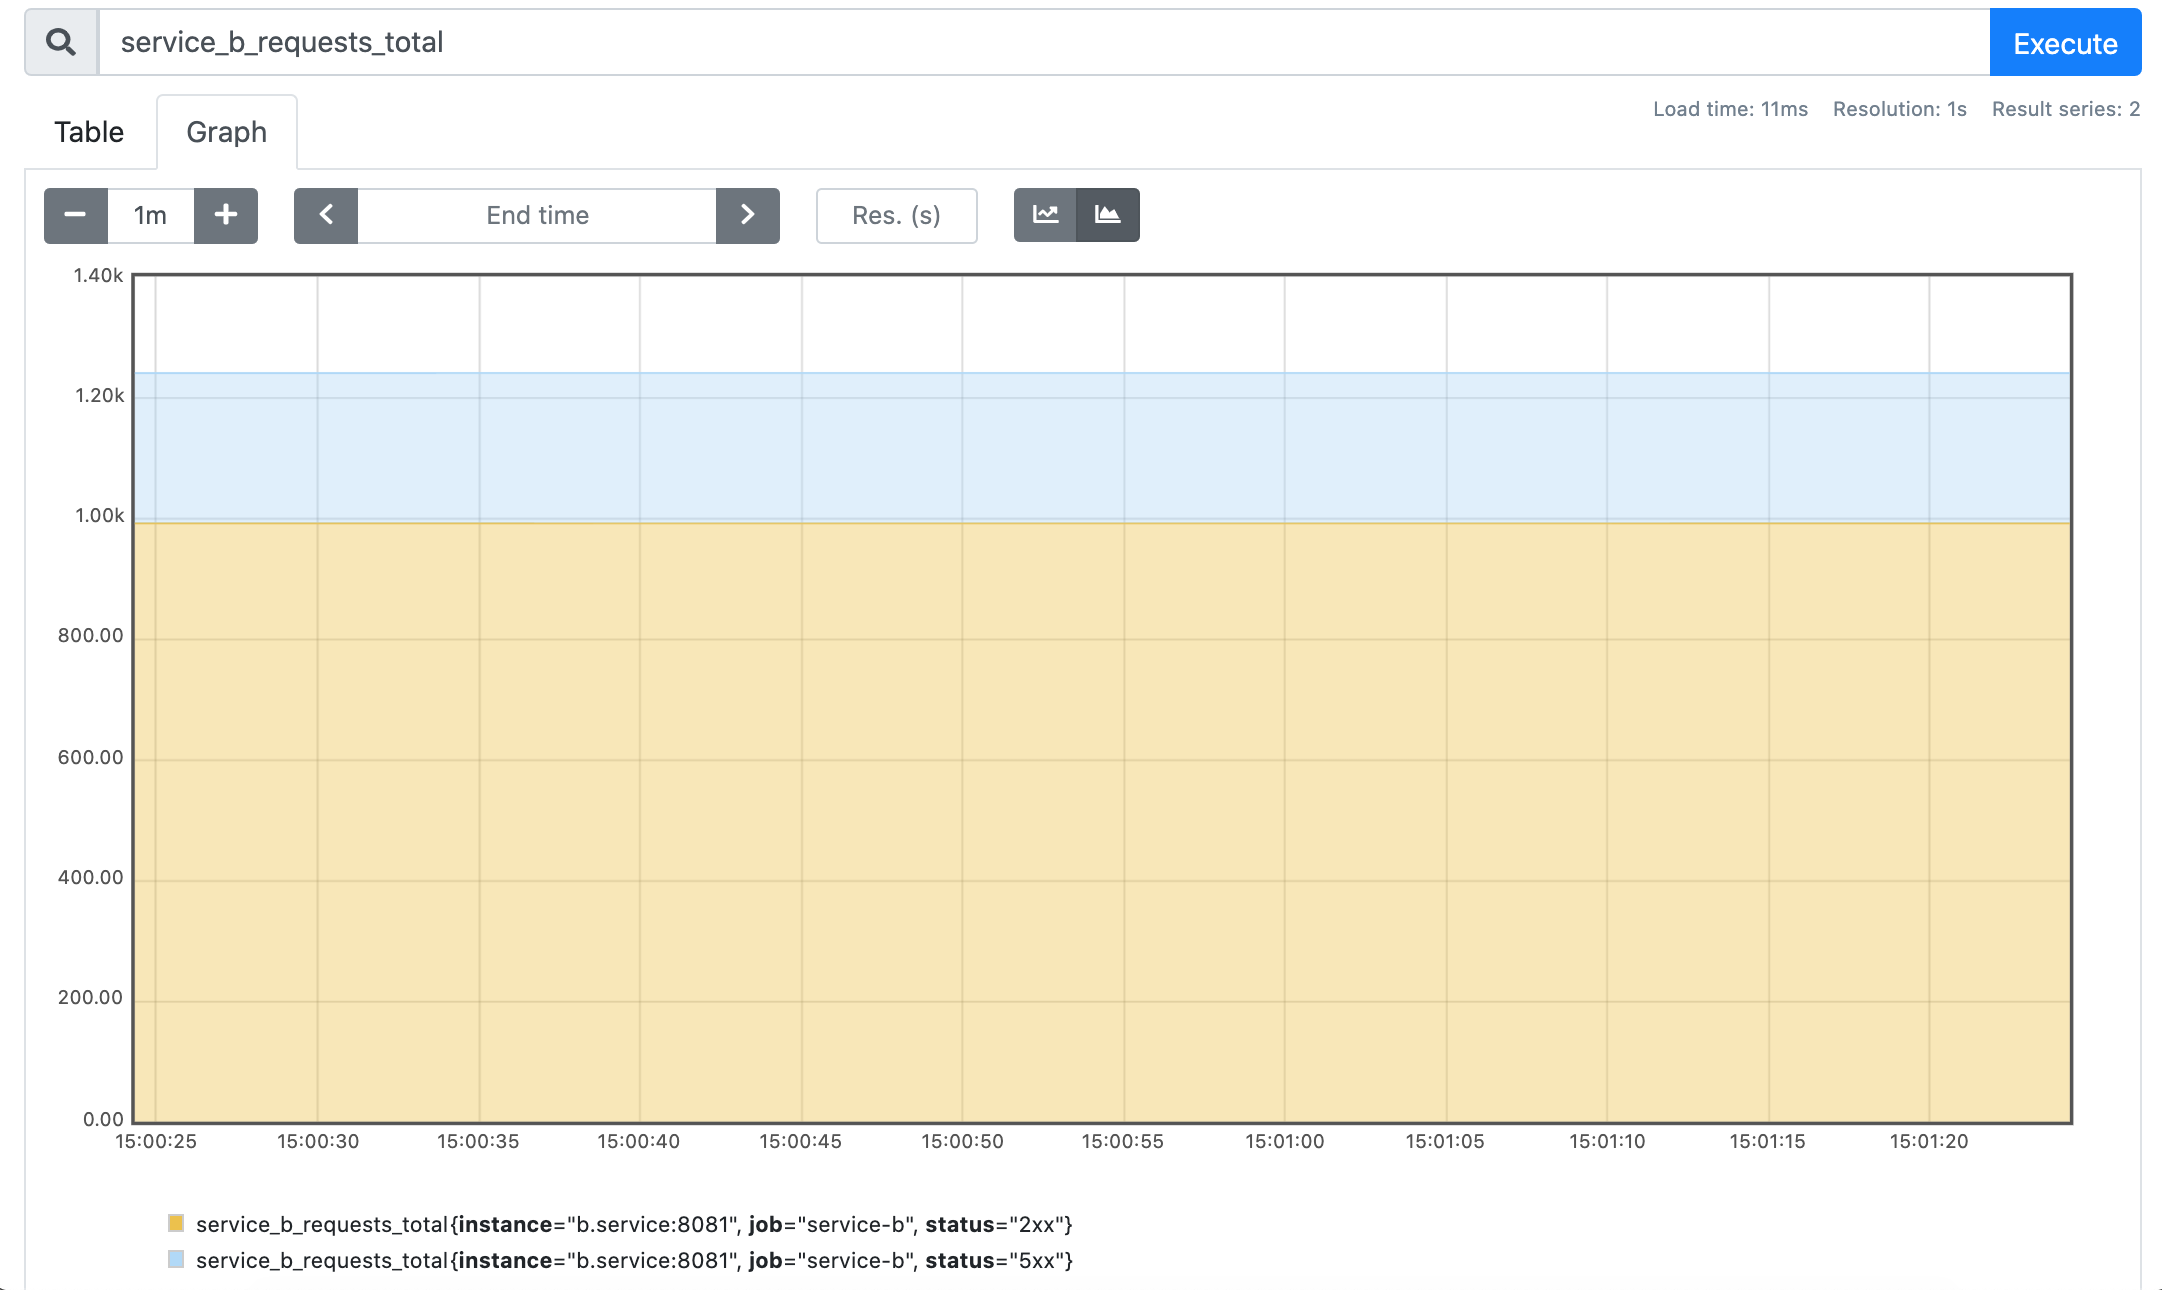
service_b_requests_total
Here we definitely can see the change. Instead of the original 1000, this time service B got about 1250 requests in total. However, only about 1000 have been served successfully.
What can the envoy sidecar tell us?
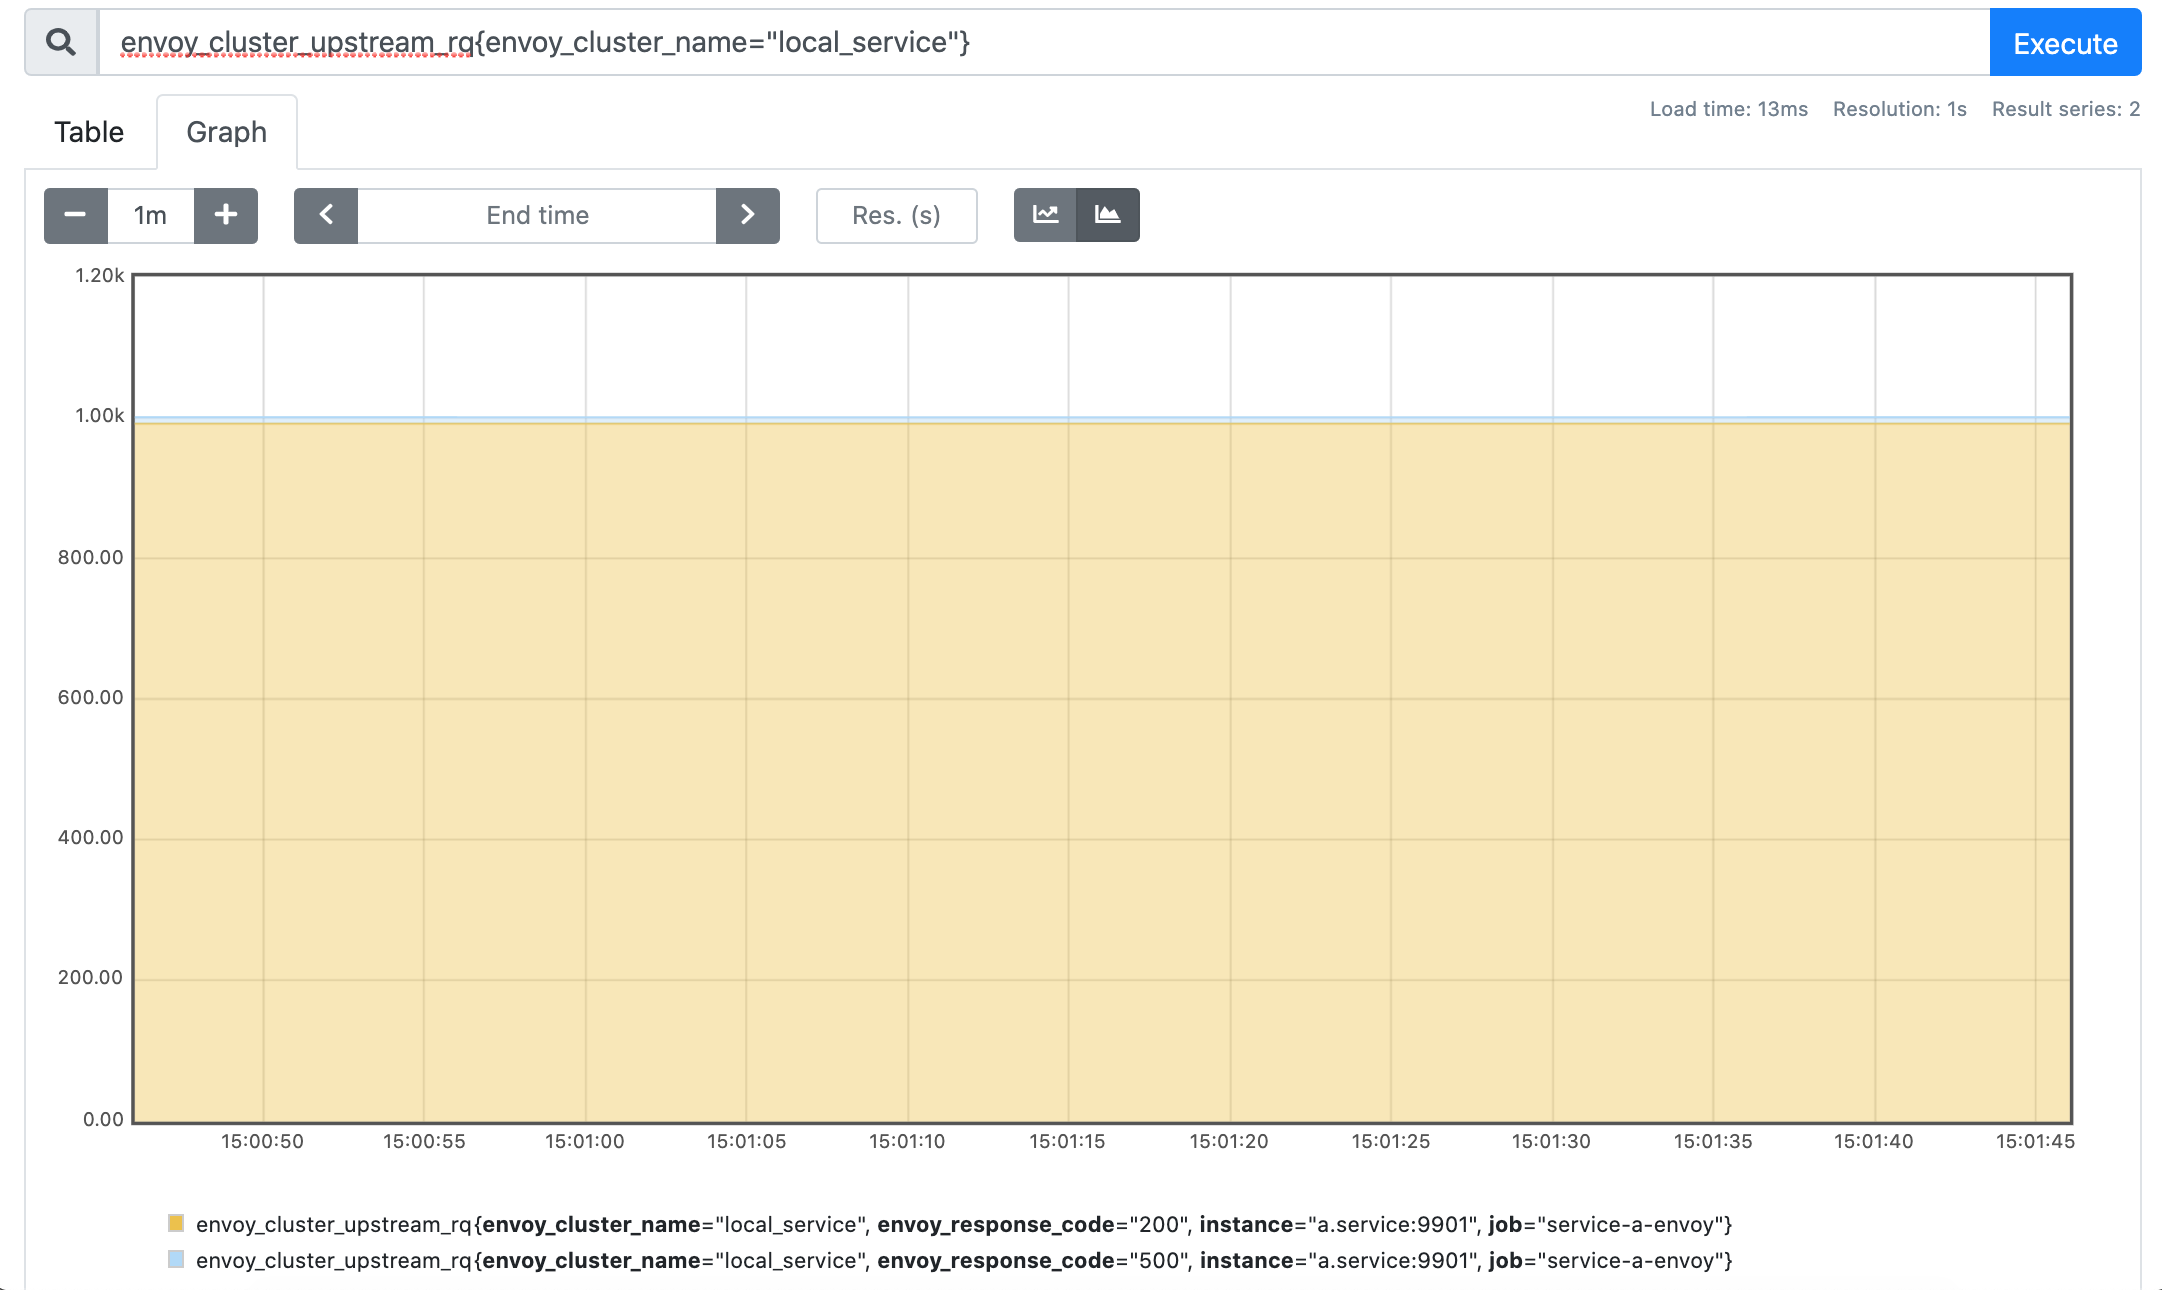
envoy_cluster_upstream_rq{envoy_cluster_name="local_service"}
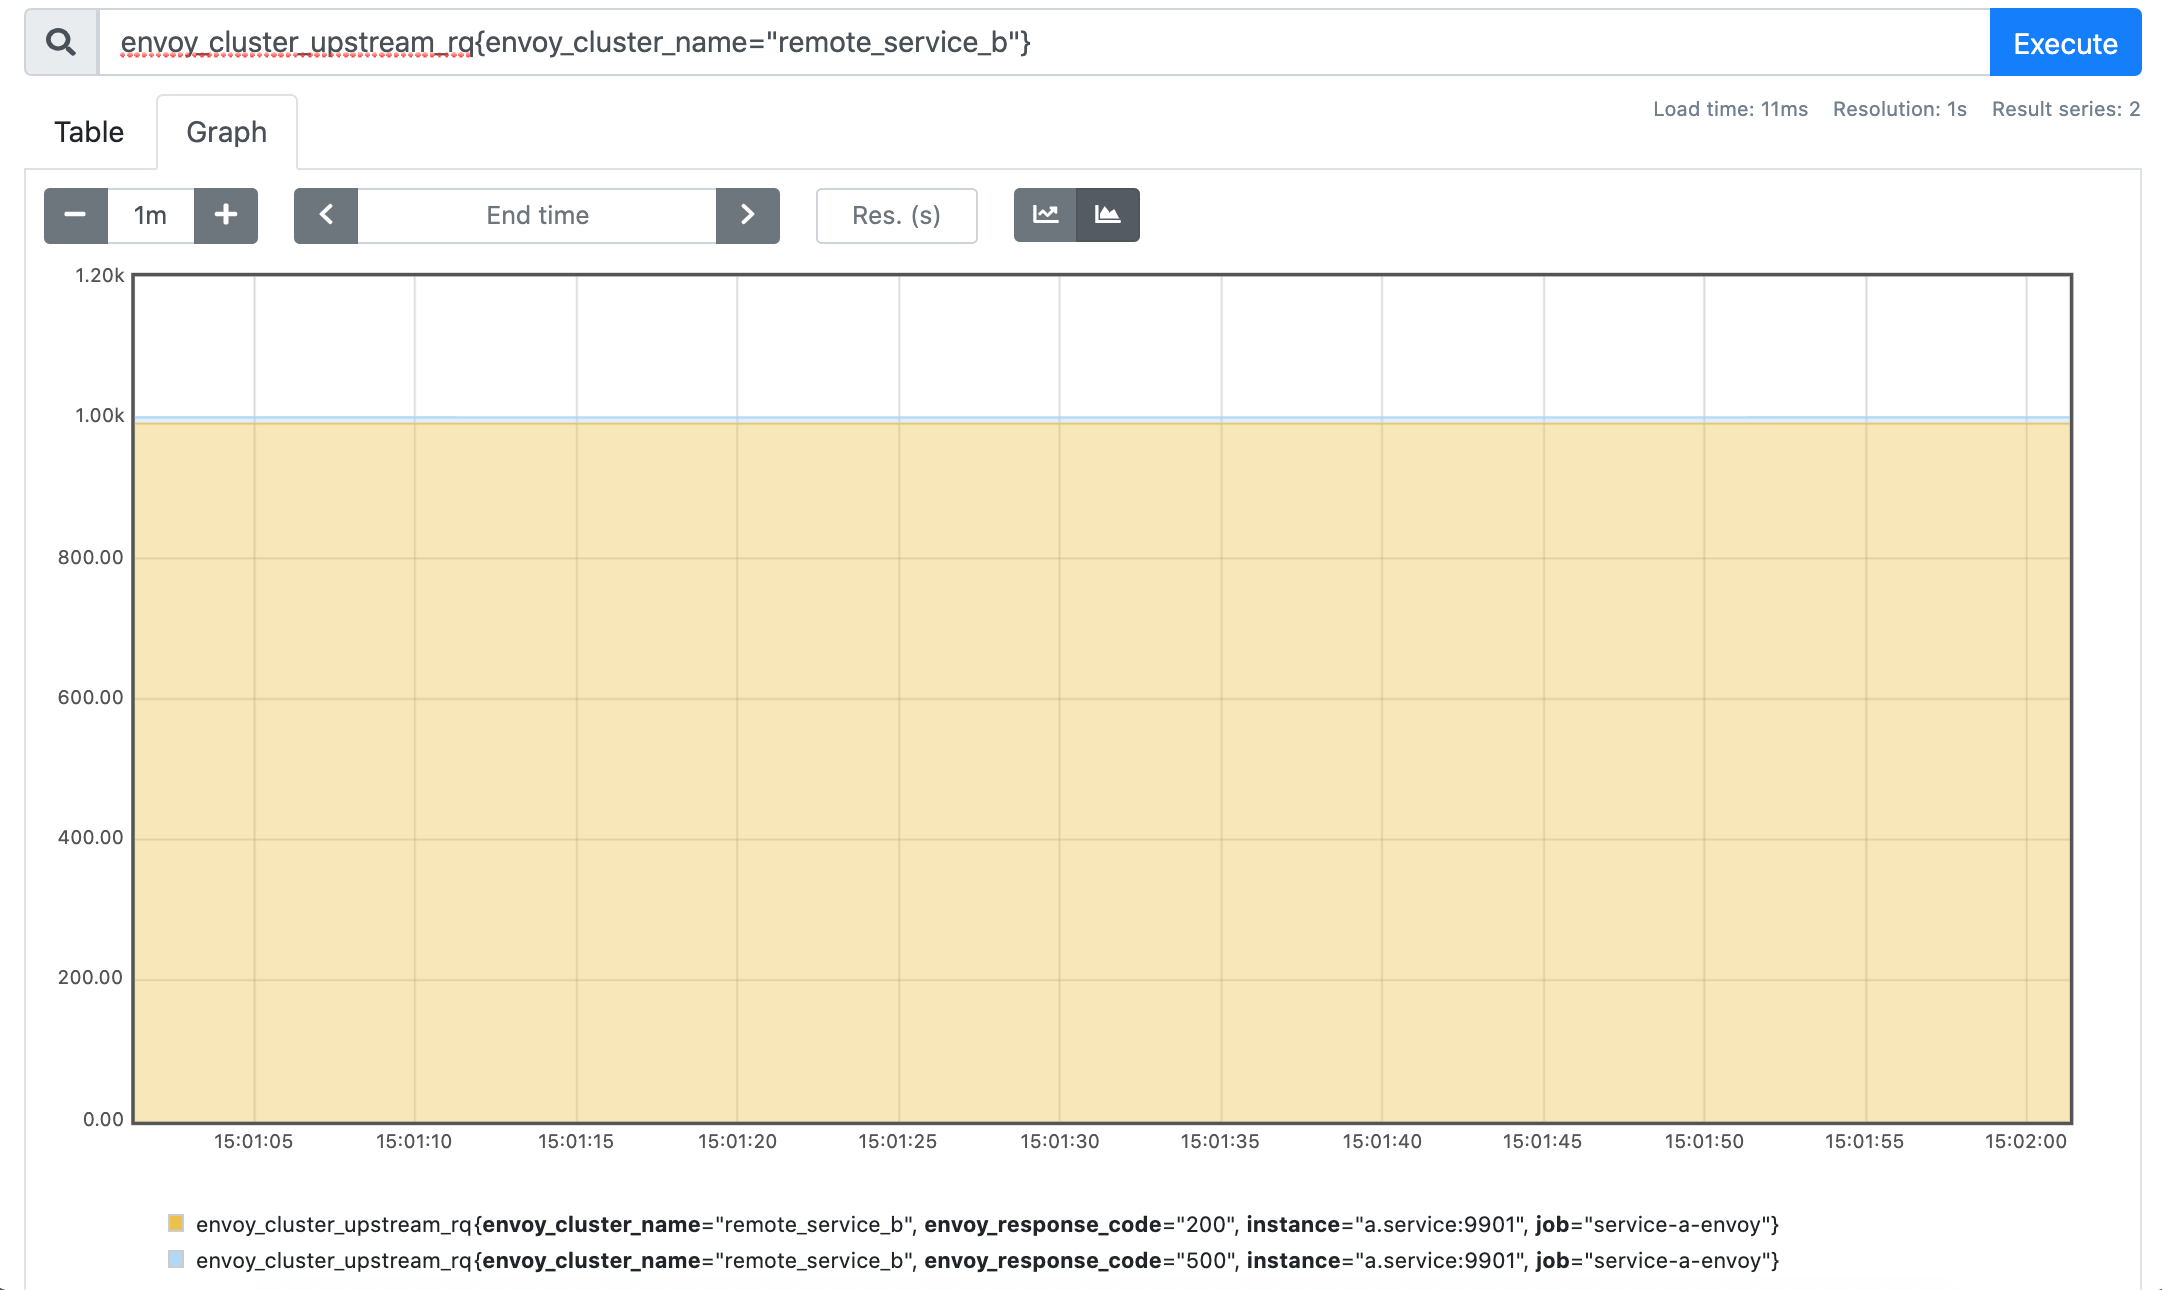
envoy_cluster_upstream_rq{envoy_cluster_name="remote_service_b"}
While both local_service and remote_service_b clusters don't shed much light on the actual number of retries that were made, there is another metric we can check:
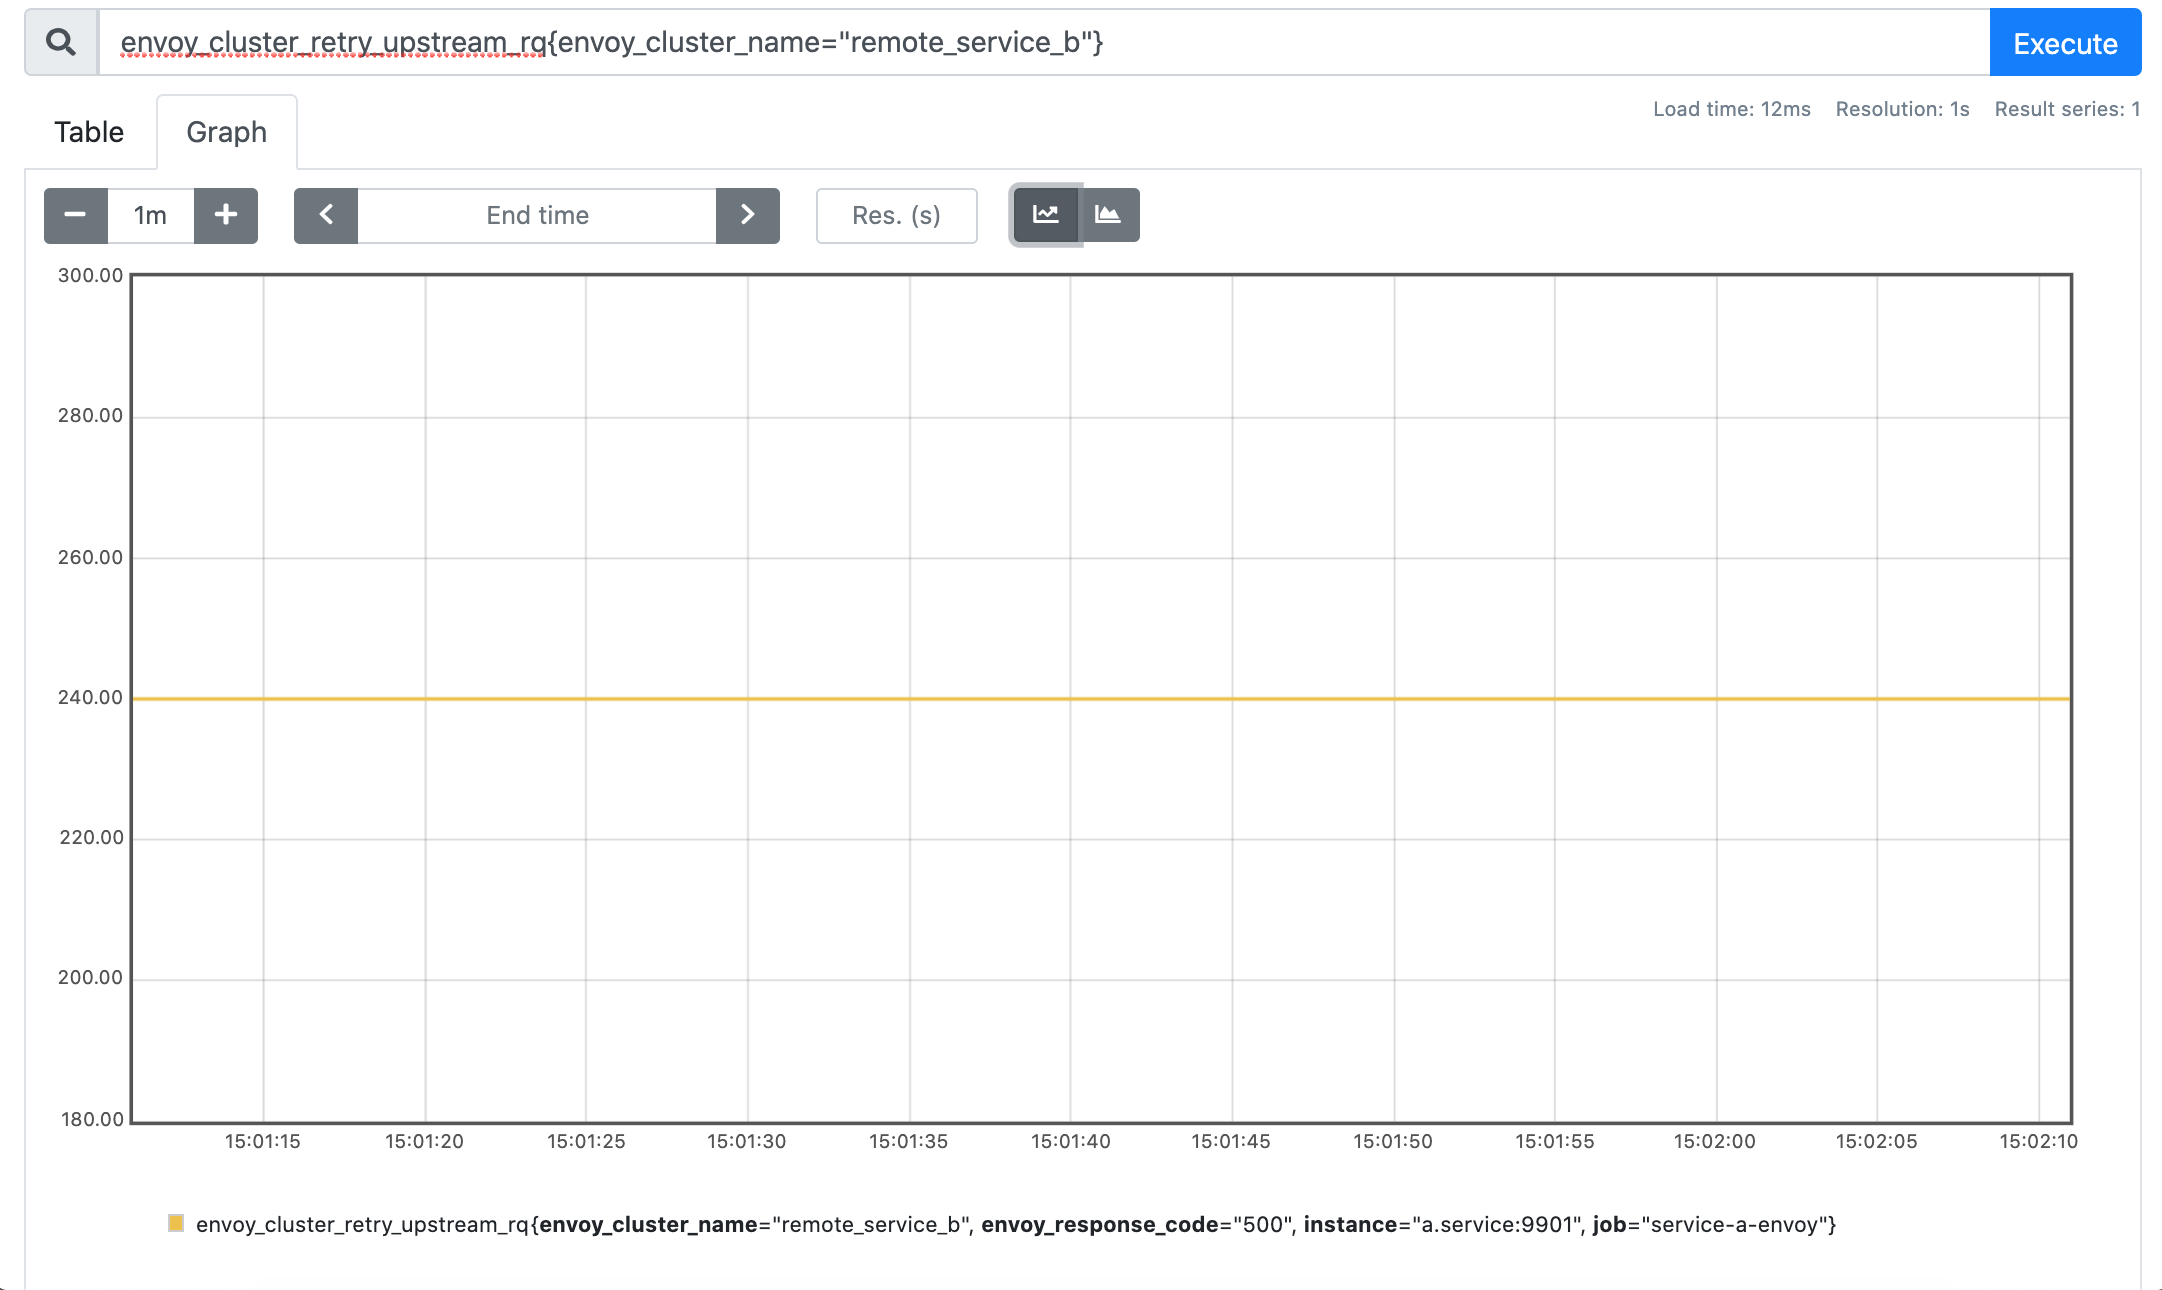
envoy_cluster_retry_upstream_rq{envoy_cluster_name="remote_service_b"}
Perfect, we managed to confirm that all those ~250 extra requests the service B received are actually retries originated by the envoy sidecar!
Instead of conclusion
I hope you enjoyed playing with all these pods and sidecars as much as I did. It's always beneficial to build such demos from time to time because often the amount of insights you're going to get while working on it is underestimated. So, I encourage everyone to get the hands dirty and share your findings! See you next time!
- Container Networking Is Simple!
- What Actually Happens When You Publish a Container Port
- How To Publish a Port of a Running Container
- Multiple Containers, Same Port, no Reverse Proxy...
- Service Proxy, Pod, Sidecar, oh my!
- Service Discovery in Kubernetes: Combining the Best of Two Worlds
- Traefik: canary deployments with weighted load balancing
Don't miss new posts in the series! Subscribe to the blog updates and get deep technical write-ups on Cloud Native topics direct into your inbox.
