My Choice of Programming Languages

When I was a kid, I used to spend days tinkering with woodworking tools. I was lucky enough to have a wide set of tools at my disposal. However, there was no one around to give me a hint about what tool to use when. So, I quickly came up with a heuristic: if my fingers and a tool survived an exercise, I've used the right tool; if either the fingers or the tool got damaged, I'd try other tools for the same task until I find the right one. And it worked quite well for me! Since then, I'm an apologist of the idea that every tool is good only for a certain set of tasks.

A programming language is yet another kind of tool. When I became a software developer, I adapted my heuristic to the new reality: if, while solving a task using a certain language, I suffer too much (fingers damage) or I need to hack things more often than not (tool damage), it's a wrong choice of a language.

Since the language is just a tool, my programming toolbox is defined by the tasks I work on the most often. Since 2010, I've worked in many domains, starting from web UI development and ending with writing code for infrastructure components. I find pleasure in being a generalist (jack of all trades), but there is always a pitfall of spreading yourself too thin (master of none). So, for the past few years, I've been trying to limit my sphere of expertise with the server-side, distributed systems, and infrastructure. Hence, the following choice of languages.

Language logos

Read more

Prometheus Cheat Sheet - Basics (Metrics, Labels, Time Series, Scraping)

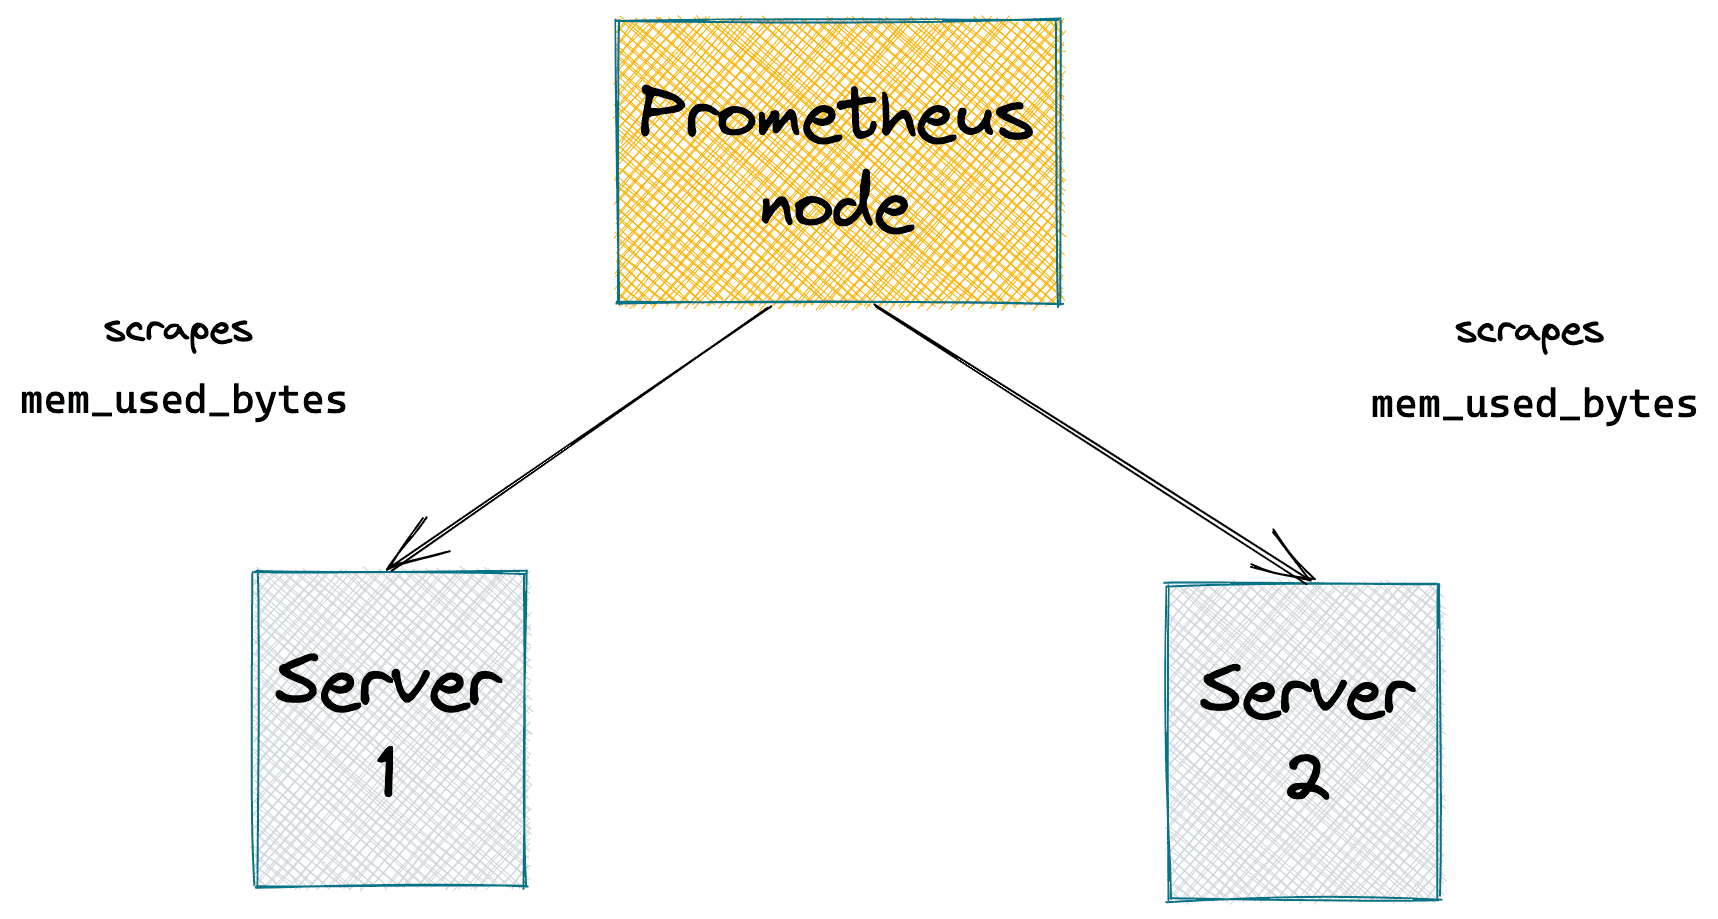
Here we focus on the most basic Prometheus concepts - metrics, labels, scrapes, and time series.

What is a metric?

In Prometheus, everything revolves around metrics. A metric is a feature (i.e., a characteristic) of a system that is being measured. Typical examples of metrics are:

  • http_requests_total
  • http_request_size_bytes
  • system_memory_used_bytes
  • node_network_receive_bytes_total
Prometheus metrics

Read more

Prometheus Is Not a TSDB

Misconception - the right word to explain my early Prometheus experience. I came to Prometheus with vast Graphite and moderate InfluxDB experience. In my eyes, Graphite was a highly performant but fairly limited system. Metrics in Graphite are just strings (well, dotted), and the values are always stored aggregated with the lowest possible resolution of 1 second. But due to these limitations, Graphite is fast. In contrast, InfluxDB adopts Metrics 2.0 format with multiple tags and fields per metric. It also allows the storage of non-aggregated data points with impressive nanosecond precision. But this power needs to be used carefully. Otherwise, you'll get all sorts of performance issues.

Prometheus is not a TSDB

Read more

How to learn PromQL with Prometheus Playground

Working with real metrics is hard. Metrics are needed to give you an understanding of how your service behaves. That is, by definition, you have some uncertainty about the said behavior. Therefore, you have to be hell certain about your observability part. Otherwise, all sorts of metric misinterpretations and false conclusions will follow.

Here are the things I'm always trying to get confident about as soon as possible:

  • How metric collection works - push vs. pull model, aggregation on the client- or server-side?
  • How metrics are stored - raw samples or aggregated data, rollup and retention strategies?
  • How to query metrics - is my mental model aligned with the actual query execution model?
  • How to plot query results - what approximation errors may be induced by the graphing tools?

And even if I have a solid understanding of all of the above stuff, there will be one thing I'm never entirely sure about - the correctness of my query logic. But this one becomes testable once other parts are known.

Recently, I've been through another round of this journey - I was making an acquaintance with Prometheus. Since it was already a third of fourth monitoring system I had to work with, at first, I thought I could skip all the said steps and jump into writing queries to production metrics and reading graphs... The hope was on the knowledge extrapolation. But nope, it didn't work out well. So, I gave up on the idea of cutting corners quickly. That's how I found myself setting up a Prometheus playground, feeding it with some known inputs, observing the outputs, and trying to draw some meaningful conclusion.

Read more

Rust - Writing Parsers With nom Parser Combinator Framework

I've been working on my new Rust side-project for several months now, and I've got some learnings to share. The project is called pq - it's a command-line tool to parse and query log files as time series. It comes with its own domain-specific language that is highly influenced by PromQL. A typical pq usage may look like this:

tail -f /var/log/nginx/access.log | pq '
/...some fancy regex.../
| map {
    .0 as ip,
    .1:ts,
    .2 as method,
    .3:str as status_code,
    .4 as content_len
  }
| select topk(
      10,
      sum(
          count_over_time(
              __line__{method="GET", status_code="200"}[1s]
          )
      ) by (ip)
  )
| to_json
'

pq has many components, including various log parsing strategies and a pretty sophisticated query execution engine. But surprisingly or not, about half of the time I've put into this project so far was dedicated to writing the parser of the pq's own query language. To be honest, when I was starting the project, I didn't see that coming...

nom logo

Luckily, writing a parser in Rust was mostly a pleasant experience, thanks to a crate concisely named nom. Although learning how to write parsers with nom wasn't completely seamless. So here is my journey.

Read more