- Prometheus Is Not a TSDB
- How to learn PromQL with Prometheus Playground
- Prometheus Cheat Sheet - Basics (Metrics, Labels, Time Series, Scraping)
- Prometheus Cheat Sheet - How to Join Multiple Metrics (Vector Matching)
- Prometheus Cheat Sheet - Moving Average, Max, Min, etc (Aggregation Over Time)
Don't miss new posts in the series! Subscribe to the blog updates and get deep technical write-ups on Cloud Native topics direct into your inbox.
Working with real metrics is hard. Metrics are needed to give you an understanding of how your service behaves. That is, by definition, you have some uncertainty about the said behavior. Therefore, you have to be hell certain about your observability part. Otherwise, all sorts of metric misinterpretations and false conclusions will follow.
Here are the things I'm always trying to get confident about as soon as possible:
- How metric collection works - push vs. pull model, aggregation on the client- or server-side?
- How metrics are stored - raw samples or aggregated data, rollup and retention strategies?
- How to query metrics - is my mental model aligned with the actual query execution model?
- How to plot query results - what approximation errors may be induced by the graphing tools?
And even if I have a solid understanding of all of the above stuff, there will be one thing I'm never entirely sure about - the correctness of my query logic. But this one becomes testable once other parts are known.
Recently, I've been through another round of this journey - I was making an acquaintance with Prometheus. Since it was already a third of fourth monitoring system I had to work with, at first, I thought I could skip all the said steps and jump into writing queries to production metrics and reading graphs... The hope was on the knowledge extrapolation. But nope, it didn't work out well. So, I gave up on the idea of cutting corners quickly. That's how I found myself setting up a Prometheus playground, feeding it with some known inputs, observing the outputs, and trying to draw some meaningful conclusion.
Setting up Prometheus playground
A shallow Internet search showed that there are some playgrounds already (1, 2, 3, 4). However, none of them suited my needs well. It was either an attempt to demo all the Prometheus capabilities in one place (alertmanager integration, federation, basic auth, etc) or a certain staged setup prepopulated with some obscure data (so I would need to learn the dataset first).
Instead, I needed a scratch Prometheus instance where I'd have full control over the server configs. And an ability to feed it with synthetic datasets so I could answer the following questions with certainty:
- How to join metrics - what are the vector matching rules?
- What does instant vector really mean?
- How the instant vector is different from the range vector?
- How Prometheus deals with missing scrapes?
- What is a lookback delta?
- Et cetera, et cetera...
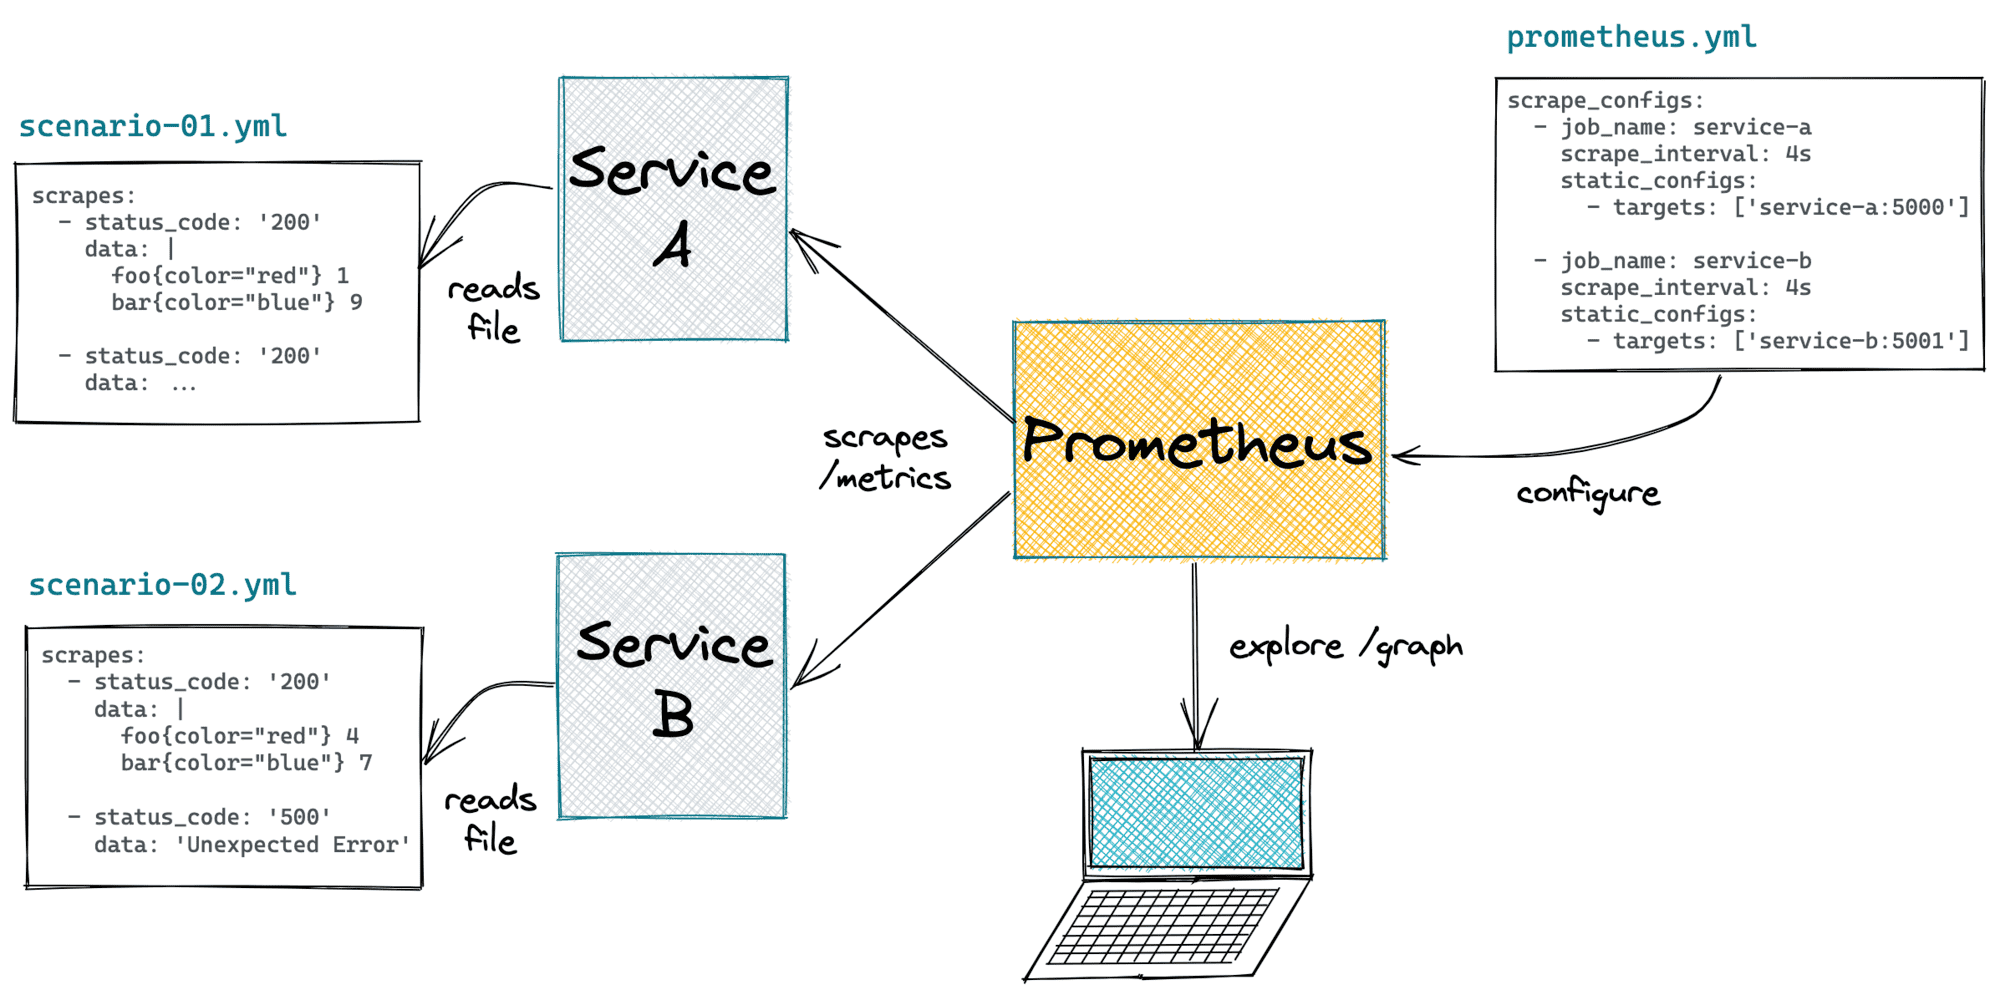
Prometheus doesn't support bulk imports yet. Or maybe it does, but I just couldn't find a simple way to preload a Prometheus instance with some historical data. And since the scraping behavior was also one of the gray areas for me, I ended up with the following approach:

- Create a fake service exposing
/metricsendpoint. It'd simulate a web service instrumented with the Prometheus client. The only purpose of this service is to reproduce a certain scenario written as a YAML file:
# scenario-01/service-a.yaml (tape)
---
scrapes:
  - status_code: '200'
    data: |
      foo{color="red",size="small"} 4
      foo{color="green",size="small"} 8
      bar{color="green",size="xlarge"} 2
      bar{color="blue",size="large"} 7

  - status_code: '500'
    data: 'Unexpected Error'

  - status_code: '200'
    data: |
      foo{color="blue",size="small"} 16
      foo{color="red",size="large"} 5
      bar{color="red",size="small"} 5
- Run one or many such services and a properly-configured Prometheus instance as a
docker-composeenvironment:
# scenario-01/docker-compose.yaml
---
version: "3.9"
services:
  service-a:
    build: ../service
    hostname: service-a
    environment:
      FLASK_RUN_PORT: "5000"
      SCRAPE_TAPE: '/var/lib/scrapes.yaml'
    volumes:
      - ./service-a.yaml:/var/lib/scrapes.yaml
  service-b:
    build: ../service
    hostname: service-b
    environment:
      FLASK_RUN_PORT: "5001"
      SCRAPE_TAPE: '/var/lib/scrapes.yaml'
    volumes:
      - ./service-b.yaml:/var/lib/scrapes.yaml
  prometheus:
    image: prom/prometheus:latest
    entrypoint:
      - "/bin/prometheus"
      - "--config.file=/opt/prometheus/prometheus.yml"
      - "--query.lookback-delta=15s"  # <-- setting shorter lookback duration
    ports:
      - "55055:9090"
    volumes:
      - ./prometheus.yml:/opt/prometheus/prometheus.yml
- Open the graph explorer on
localhost:55055and run some PromQL queries.
Check out the full playground code on GitHub.
The simplicity of this setup allowed me to experiment really quickly. Yes, I may need to wait until a few scrapes happen. However, short scrapes intervals and custom lookback-delta usually reduce the waiting time to under one minute. And as a result, I got lots of interesting insights about PromQL and Prometheus behavior!
- Prometheus Is Not a TSDB
- How to learn PromQL with Prometheus Playground
- Prometheus Cheat Sheet - Basics (Metrics, Labels, Time Series, Scraping)
- Prometheus Cheat Sheet - How to Join Multiple Metrics (Vector Matching)
- Prometheus Cheat Sheet - Moving Average, Max, Min, etc (Aggregation Over Time)
Don't miss new posts in the series! Subscribe to the blog updates and get deep technical write-ups on Cloud Native topics direct into your inbox.