- Docker: How To Debug Distroless And Slim Containers
- Kubernetes Ephemeral Containers and kubectl debug Command
- Containers 101: attach vs. exec - what's the difference?
- Why and How to Use containerd From Command Line
- Docker: How To Extract Image Filesystem Without Running Any Containers
- KiND - How I Wasted a Day Loading Local Docker Images
Don't miss new posts in the series! Subscribe to the blog updates and get deep technical write-ups on Cloud Native topics direct into your inbox.
UPD: Check out iximiuz/cdebug - a container debugging tool that automates some of the techniques from this post.
Slim containers are faster (less stuff to move around) and more secure (fewer places for vulnerabilities to sneak in). However, these benefits of slim containers come at a price - such containers lack (the much-needed at times) exploration and debugging tools. It might be quite challenging to tap into a container that was built from a distroless or slim base image or was minified using DockerSlim or alike. Over the years, I've learned a few tricks how to troubleshoot slim containers, and it's time for me to share.
Installing debugging tools on demand
The most obvious solution is to put the debugging tools back when you need them. For instance, a container built from debian:stable-slim lacks even the basic stuff like ps:
$ docker run -d --rm --name my-slim debian:stable-slim \
  sleep 9999

# Nice, the shell is there!
$ docker exec -it my-slim bash
root@6aa917a50213:/$#

# But many tools are missing.
root@6aa917a50213:/$# ps
bash: ps: command not found
You can "fix" it by installing the procps package right into the running container:
root@6aa917a50213:/$# apt-get update; apt-get install -y procps
root@6aa917a50213:/$# ps

    PID TTY          TIME CMD
      7 pts/0    00:00:00 bash
   1058 pts/0    00:00:00 ps
The main advantage of the approach is its simplicity. But there is a bunch of significant downsides:
- You need to look up/remember the names of the packages (
apt-get install psisn't a thing). - Changes don't persist between container restarts (unless you commit them, of course).
- Installed packages can pollute the container and lead the investigation in a wrong direction.
- The approach doesn't work with distroless images since there is no shell or package manager inside.
Temporarily switching to a fat(ter) base image
The second most obvious solution is to temporarily switch to another base image. Instead of using debian:stable-slim, you can build a container from the regular debian:stable base image that has more tools preinstalled. The approach even works for GoogleContainerTools' distroless images as they provide specially tagged debug variants.
While the normal gcr.io/distroless/nodejs image lacks even the shell:
$ docker run -d --rm \
  --name my-distroless gcr.io/distroless/nodejs \
  -e 'setTimeout(() => console.log("Done"), 99999999)'

$ docker exec -it my-distroless bash
OCI runtime exec failed:
exec failed: unable to start container process:
exec: "bash": executable file not found in $PATH: unknown

$ docker exec -it my-distroless sh
OCI runtime exec failed:
exec failed: unable to start container process:
exec: "sh": executable file not found in $PATH: unknown
...the gcr.io/distroless/nodejs:debug version comes not only with the shell but also with some frequently used tools:
$ docker run -d --rm \
  --name my-distroless gcr.io/distroless/nodejs:debug \
  -e 'setTimeout(() => console.log("Done"), 99999999)'

$ docker exec -it my-distroless sh

/ $# ps
PID   USER     TIME  COMMAND
    1 root      0:00 /nodejs/bin/node -e setTimeout(() => console.log("Done"), 99999999)
   19 root      0:00 sh
   27 root      0:00 ps

/ $# ping 8.8.8.8
PING 8.8.8.8 (8.8.8.8): 56 data bytes
64 bytes from 8.8.8.8: seq=0 ttl=61 time=26.808 ms
64 bytes from 8.8.8.8: seq=1 ttl=61 time=18.175 ms
64 bytes from 8.8.8.8: seq=2 ttl=61 time=40.952 ms
However, if you need a slightly less common tool (e.g., ss), you will neither find it in the above container nor will be able to install it - the :debug base images still lack a proper package manager:
/ $# apt
sh: apt: not found
/ $# apt-get
sh: apt-get: not found
So, the only option to put your own packages into a distroless image is to rebuild the distroless base (read to learn bazel 🙈).
Chainguard's Images (and the satellite tools) may simplify the problem of adding things into distroless(-like) images, but the main inconvenience remains - building images is supposed to be an out-of-band process with the UX that is very different from a typical debugging session.
Summarizing the disadvantages of the approach:
- It's slow(er) and requires different tools and skill sets (than needed for debugging).
- The target container needs to be restarted (or rather completely replaced using the new image).
- Not every tool will be available out of the box, so you may need to fallback to the approach #1.
- The possibility of the debugging tools spoiling the container and misleading the investigation remains high.
Using docker exec and a mount
If you don't feel like messing up with images, but you still want to explore the filesystem of the misbehaving container or run some of its commands/tools despite the lack of the shell inside, the docker exec command might be really helpful.
A typical interactive shell started by the docker exec -it <target> sh command would reside in the same mnt, pid, net, ipc, and uts namespaces as the target container, so it'd "feel like" being in the target container itself:
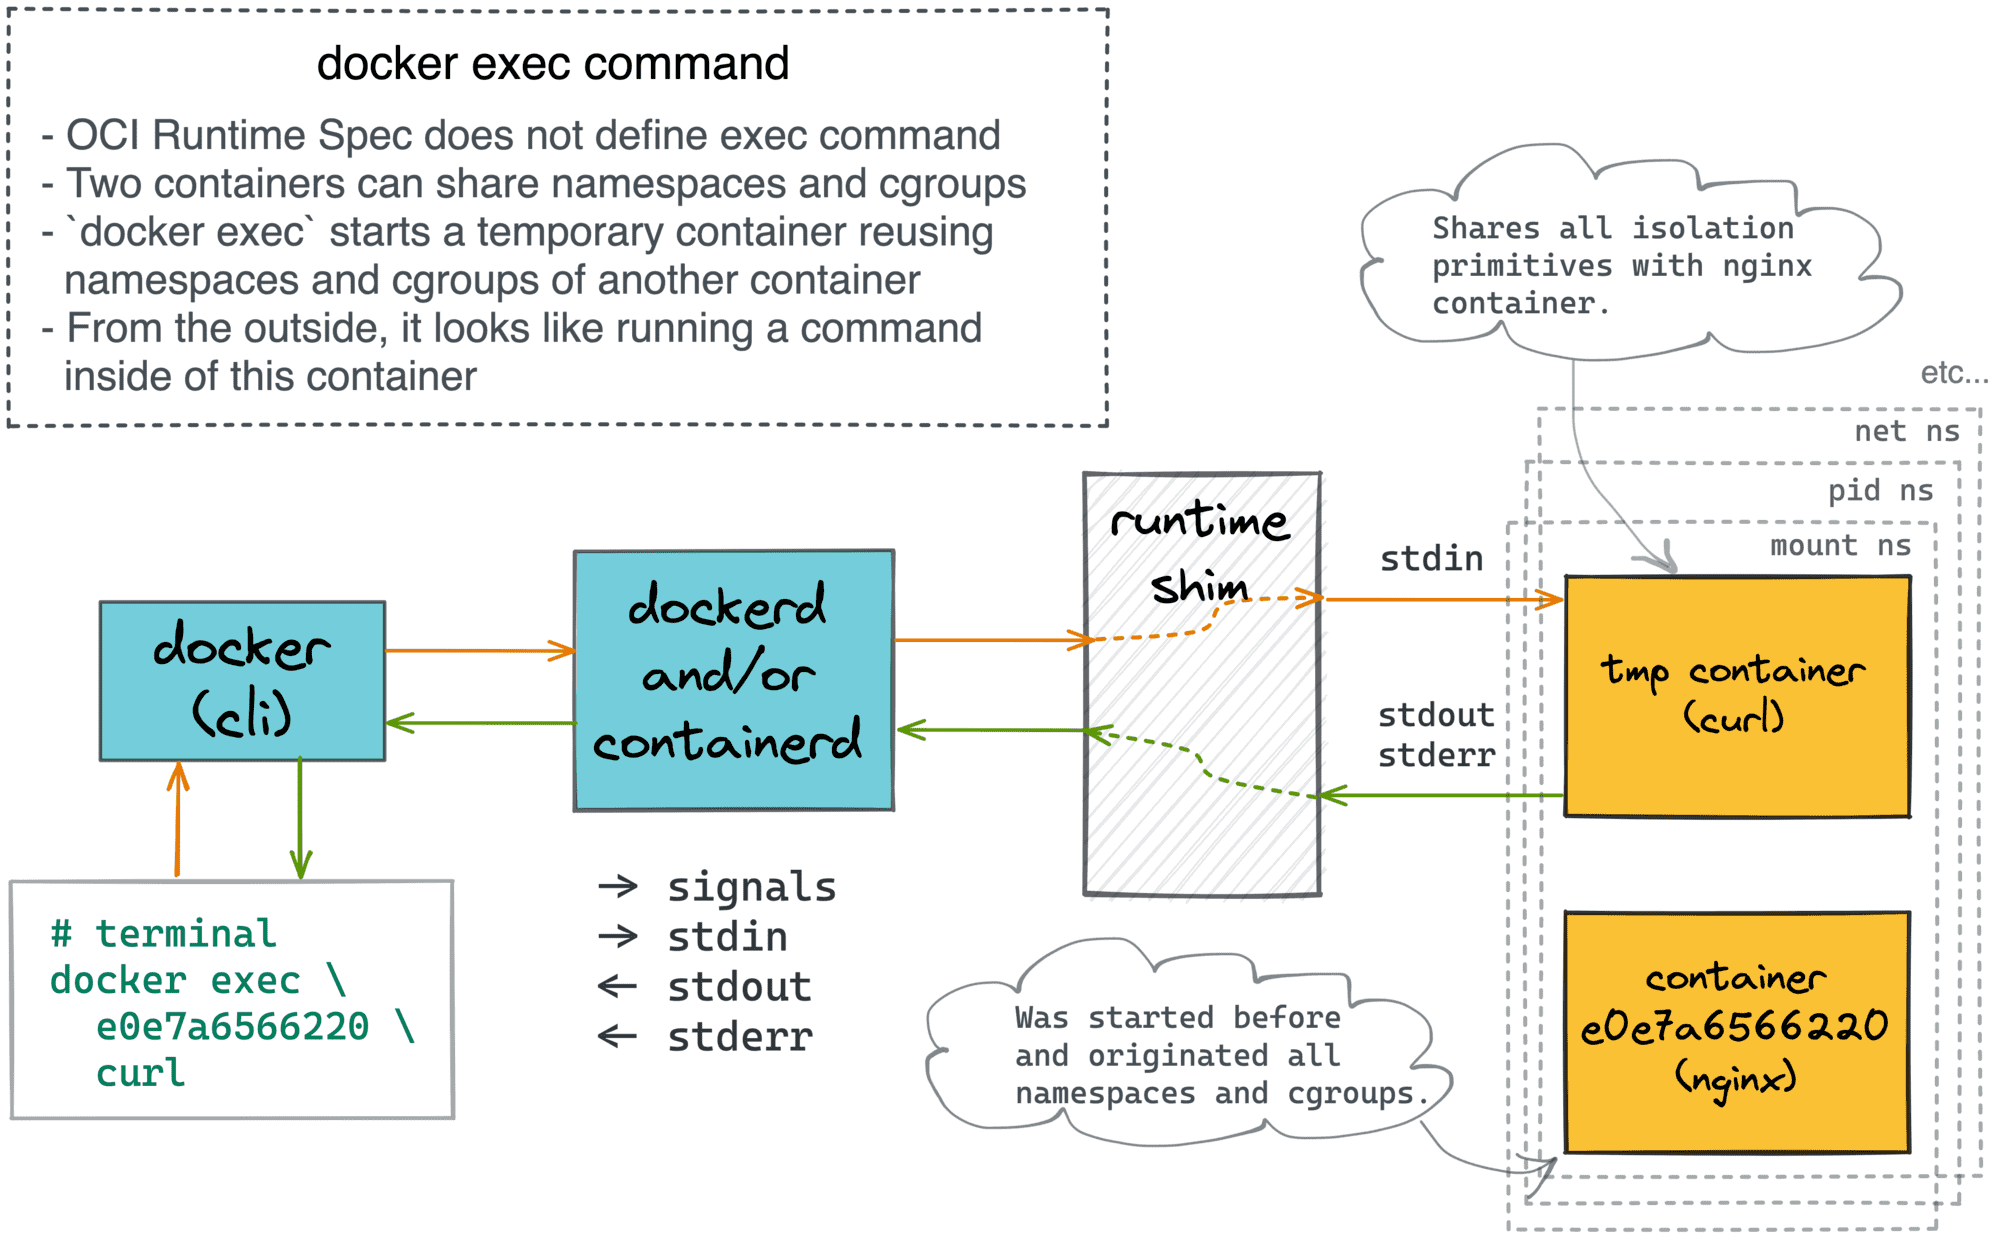
The problem is that the target container might not have a shell! So, here is how you can bring your own:
# 1. Prepare the debugger "image" (not quite):
$ docker create --name debugger busybox
$ mkdir debugger
$ docker export debugger | tar -xC debugger


# 2. Start the guinea-pig container (distroless):
$ docker run -d --rm \
  -v $(pwd)/debugger:/.debugger \
  --name my-distroless gcr.io/distroless/nodejs \
  -e 'setTimeout(() => console.log("Done"), 99999999)'


# 3. Start the debugging session:
$ docker exec -it my-distroless /.debugger/bin/sh
The above docker exec command will place you right into the target container (i.e, all its namespaces will be shared).
However, using the debugging tools from the mount will likely fail at first. For instance, let's try checking the filesystem:
$# ls -l /nodejs/
/.debugger/bin/sh: ls: not found
Luckily, there is an easy way to fix it:
/ $# export PATH=${PATH}:/.debugger/bin
💡 Important: Appending the .debugger/bin folder to the $PATH env var has a different effect than prepending it! In the case of a name collision, the binaries from the target container will have precedence over the ones residing on the .debugger/bin mount.
If the opposite is desirable, you can inverse the order: export PATH=/.debugger/bin:${PATH}.
Now, exploring the filesystem, the process tree, and the network stack of the target container feels absolutely natural:
/ $# ls -l /nodejs/
total 392
-r-xr-xr-x    1 root     root        250180 Jan  1  1970 CHANGELOG.md
-r-xr-xr-x    1 root     root         96982 Jan  1  1970 LICENSE
-r-xr-xr-x    1 root     root         35345 Jan  1  1970 README.md
drwxr-xr-x    2 root     root          4096 Jan  1  1970 bin
drwxr-xr-x    3 root     root          4096 Jan  1  1970 include
drwxr-xr-x    5 root     root          4096 Jan  1  1970 share


/ $# ps
ps
PID   USER     TIME  COMMAND
    1 root      0:00 /nodejs/bin/node -e setTimeout(() => console.log("Done"), 99999999)
   23 root      0:00 /.debugger/bin/sh
   29 root      0:00 ps


/ $# ip addr
1: lo: <LOOPBACK,UP,LOWER_UP> mtu 65536 qdisc noqueue qlen 1000
    link/loopback 00:00:00:00:00:00 brd 00:00:00:00:00:00
    inet 127.0.0.1/8 scope host lo
       valid_lft forever preferred_lft forever
132: eth0@if133: <BROADCAST,MULTICAST,UP,LOWER_UP,M-DOWN> mtu 1500 qdisc noqueue
    link/ether 02:42:ac:11:00:02 brd ff:ff:ff:ff:ff:ff
    inet 172.17.0.2/16 brd 172.17.255.255 scope global eth0
       valid_lft forever preferred_lft forever
And you can also run the binaries from the target container as usual. The best part is that we got all of that with no changes to the base of the end images!
😎 Pro Tip: Need a tool that's not in busybox? Nixery to the rescue!
The above volume + exec trick works perfectly when the tools in the volume are statically linked (e.g., the busybox toolkit). However, sometimes, you may want to use a dynamically linked tool. Here is how you can achieve it with Nixery (thanks Jérôme Petazzoni for the idea):
# 1. Prepare the debugger - it'll contain a shell (bash) and tcpdump!
$ docker create --name debugger nixery.dev/shell/tcpdump
$ mkdir debugger
$ docker export debugger | tar -xC debugger

# 2. Start the container that needs to be debugged
#    (notice how the volumes are slightly more complex)
$ docker run -d --rm \
  -v $(pwd)/debugger/nix:/nix \
  -v $(pwd)/debugger/bin:/.debugger/bin \
  --name my-distroless gcr.io/distroless/nodejs \
  -e 'setTimeout(() => console.log("Done"), 99999999)'

# 3. Start the debugging session:
$ docker exec -it my-distroless /.debugger/bin/bash
bash-5.1$# export PATH=${PATH}:/.debugger/bin
bash-5.1$# tcpdump
Nixery allows you to construct container images on-demand by simply listing names of the required tools when pulling. Such tools are installed using the Nix package manager, and Nix's magic makes them portable (even when they're dynamically linked). We just need to mount two volumes instead of one (and the first one must be always at /nix).
I discovered the above trick relatively recently, so I'll yet have to see if it'll become my new favorite approach for debugging containers.
As always, there are drawbacks, though:
- There are quite a few hoops to jump through - preparing the debugger volume takes time.
- Not every image can be used for debugging - the statically linked tools (like busybox) or Nix-based distros expectedly work the best.
Installing extra tools on demand will likely be problematicNixery.dev fixed it for me.- Mounting the debugging tools into the target container requires a restart.
Using docker run with shared namespaces
The docker exec with an extra mount approach is nice, but it requires a container restart. Can we have something similar but without interrupting the target container?
The need for debugging slim containers arises so frequently that Kubernetes even added a special kubectl debug command. I was already digging into it some time ago, so here is a quick recap:
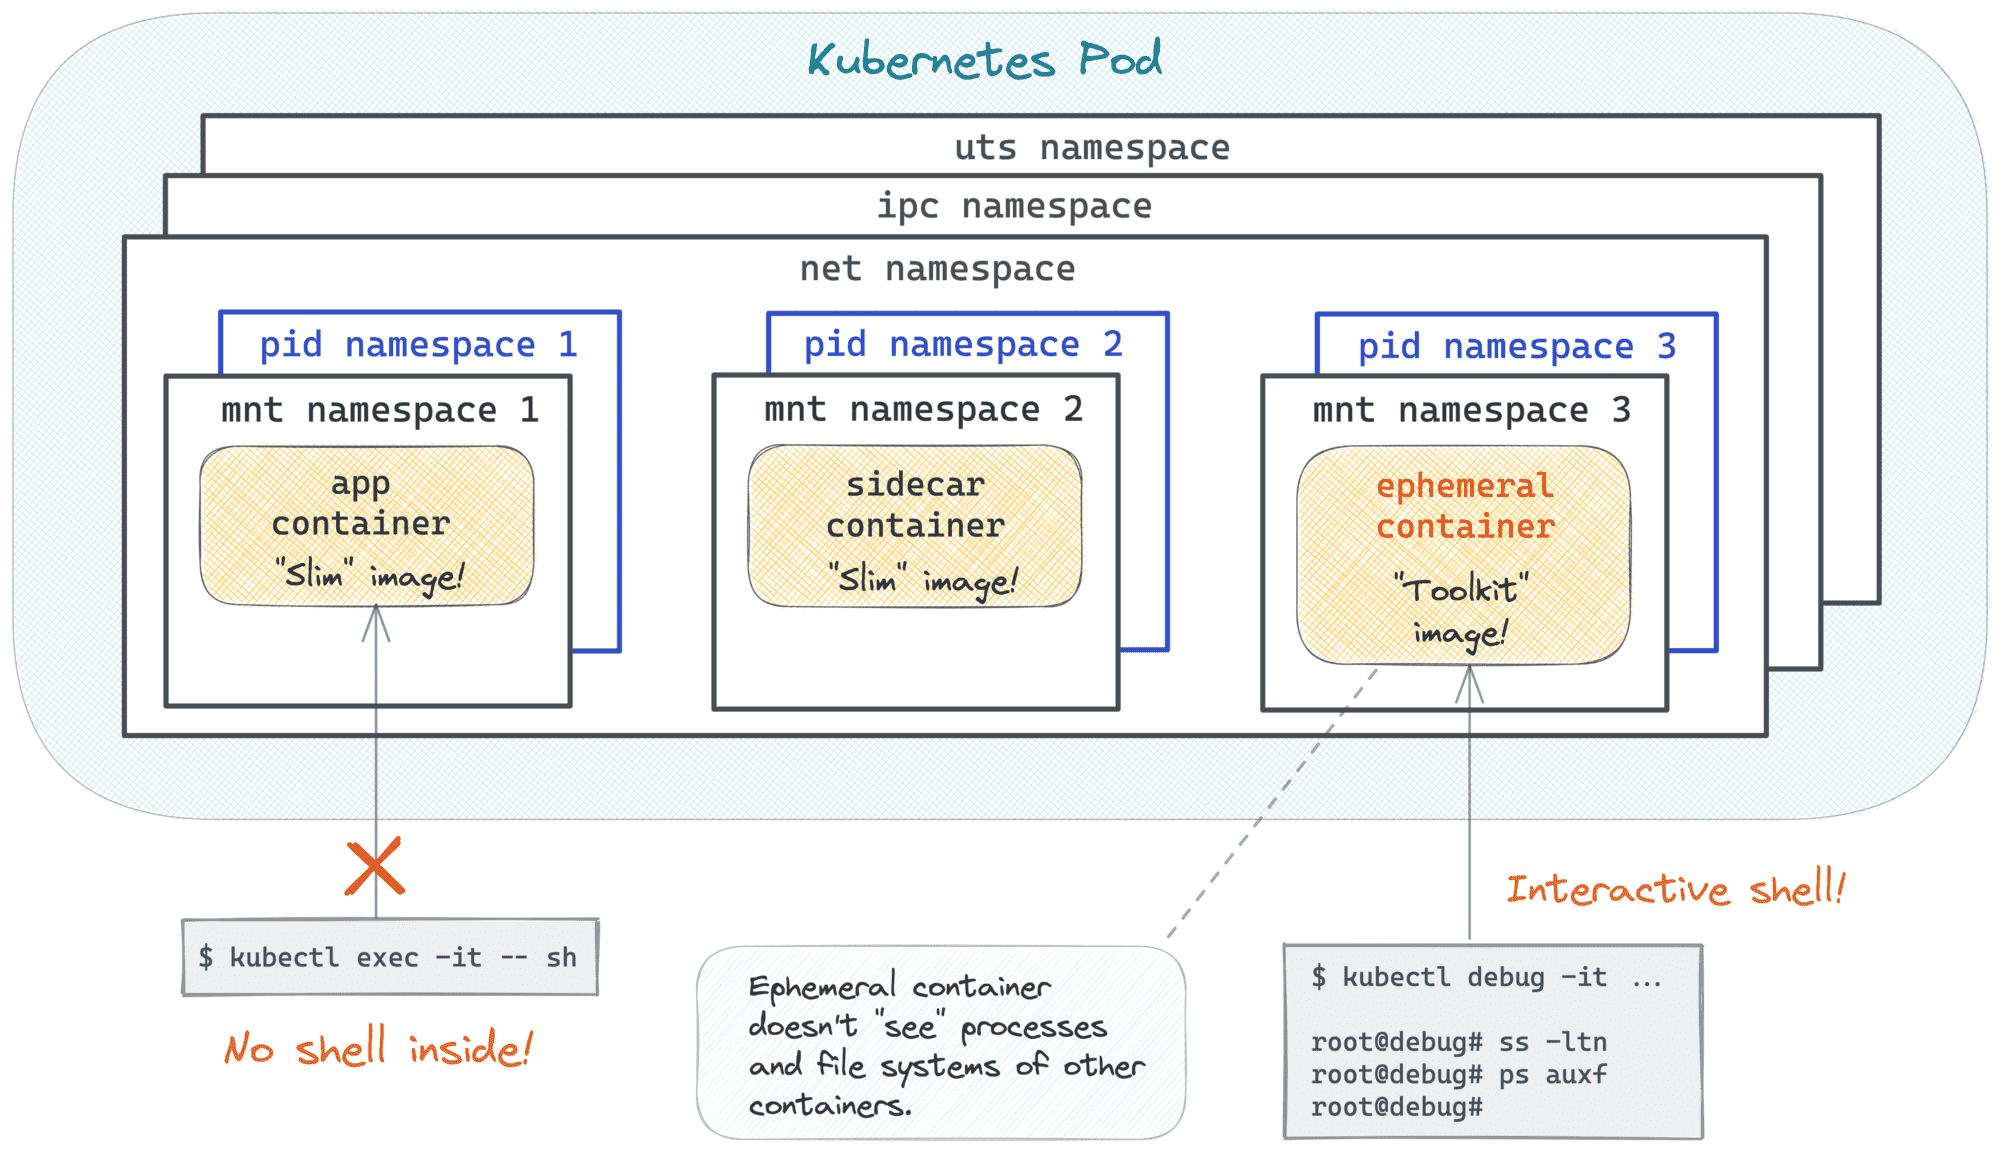
Long story short, the kubectl debug command allows you to start a temporary (so-called ephemeral) container that shares some of the isolation borders of the misbehaving Pod. And this temporary container can use your favorite toolkit image ️️🔥
The above is possible because a container can be started using one or more namespaces of another container! Essentially, it's the same technique that allowed the creation of Pods in the first place, just extended to the runtime phase. A while ago I was showing how to create Pod-like constructs using standard Docker commands. Combing the idea of ephemeral containers with the technique from that article, we can reproduce a kubectl debug-like UX in Docker:
# Preparing the guinea pig container (distroless/nodejs):
$ docker run -d --rm \
  --name my-distroless gcr.io/distroless/nodejs \
  -e 'setTimeout(() => console.log("Done"), 99999999)'

# Starting the debugger container (busybox)
$ docker run --rm -it \
  --name debugger \
  --pid container:my-distroless \
  --network container:my-distroless \
  busybox \
  sh

# Exploring/debugging the guinea pig container using the debugger's tools:
/ $# ps auxf
PID   USER     TIME  COMMAND
    1 root      0:00 /nodejs/bin/node -e setTimeout(() => console.log("Done"), 99999999)
   25 root      0:00 sh
   31 root      0:00 ps auxf

/ $# ip addr
1: lo: <LOOPBACK,UP,LOWER_UP> mtu 65536 qdisc noqueue qlen 1000
    link/loopback 00:00:00:00:00:00 brd 00:00:00:00:00:00
    inet 127.0.0.1/8 scope host lo
       valid_lft forever preferred_lft forever
128: eth0@if129: <BROADCAST,MULTICAST,UP,LOWER_UP,M-DOWN> mtu 1500 qdisc noqueue
    link/ether 02:42:ac:11:00:02 brd ff:ff:ff:ff:ff:ff
    inet 172.17.0.2/16 brd 172.17.255.255 scope global eth0
       valid_lft forever preferred_lft forever
With a simple docker run --pid container:<target> --network container:<target> you can start a debugger container that will share the pid and net namespaces of the target. The debugger container can (and probably should) bring its own tools, and using ps or ip in it will show the exact same process tree and the network stack as the target container sees itself.
This trick is so handy that we even built a PoC docker-slim debug command during an improvised Hackathon session at KubeCon EU 2022 (credit goes to Dan Čermák):
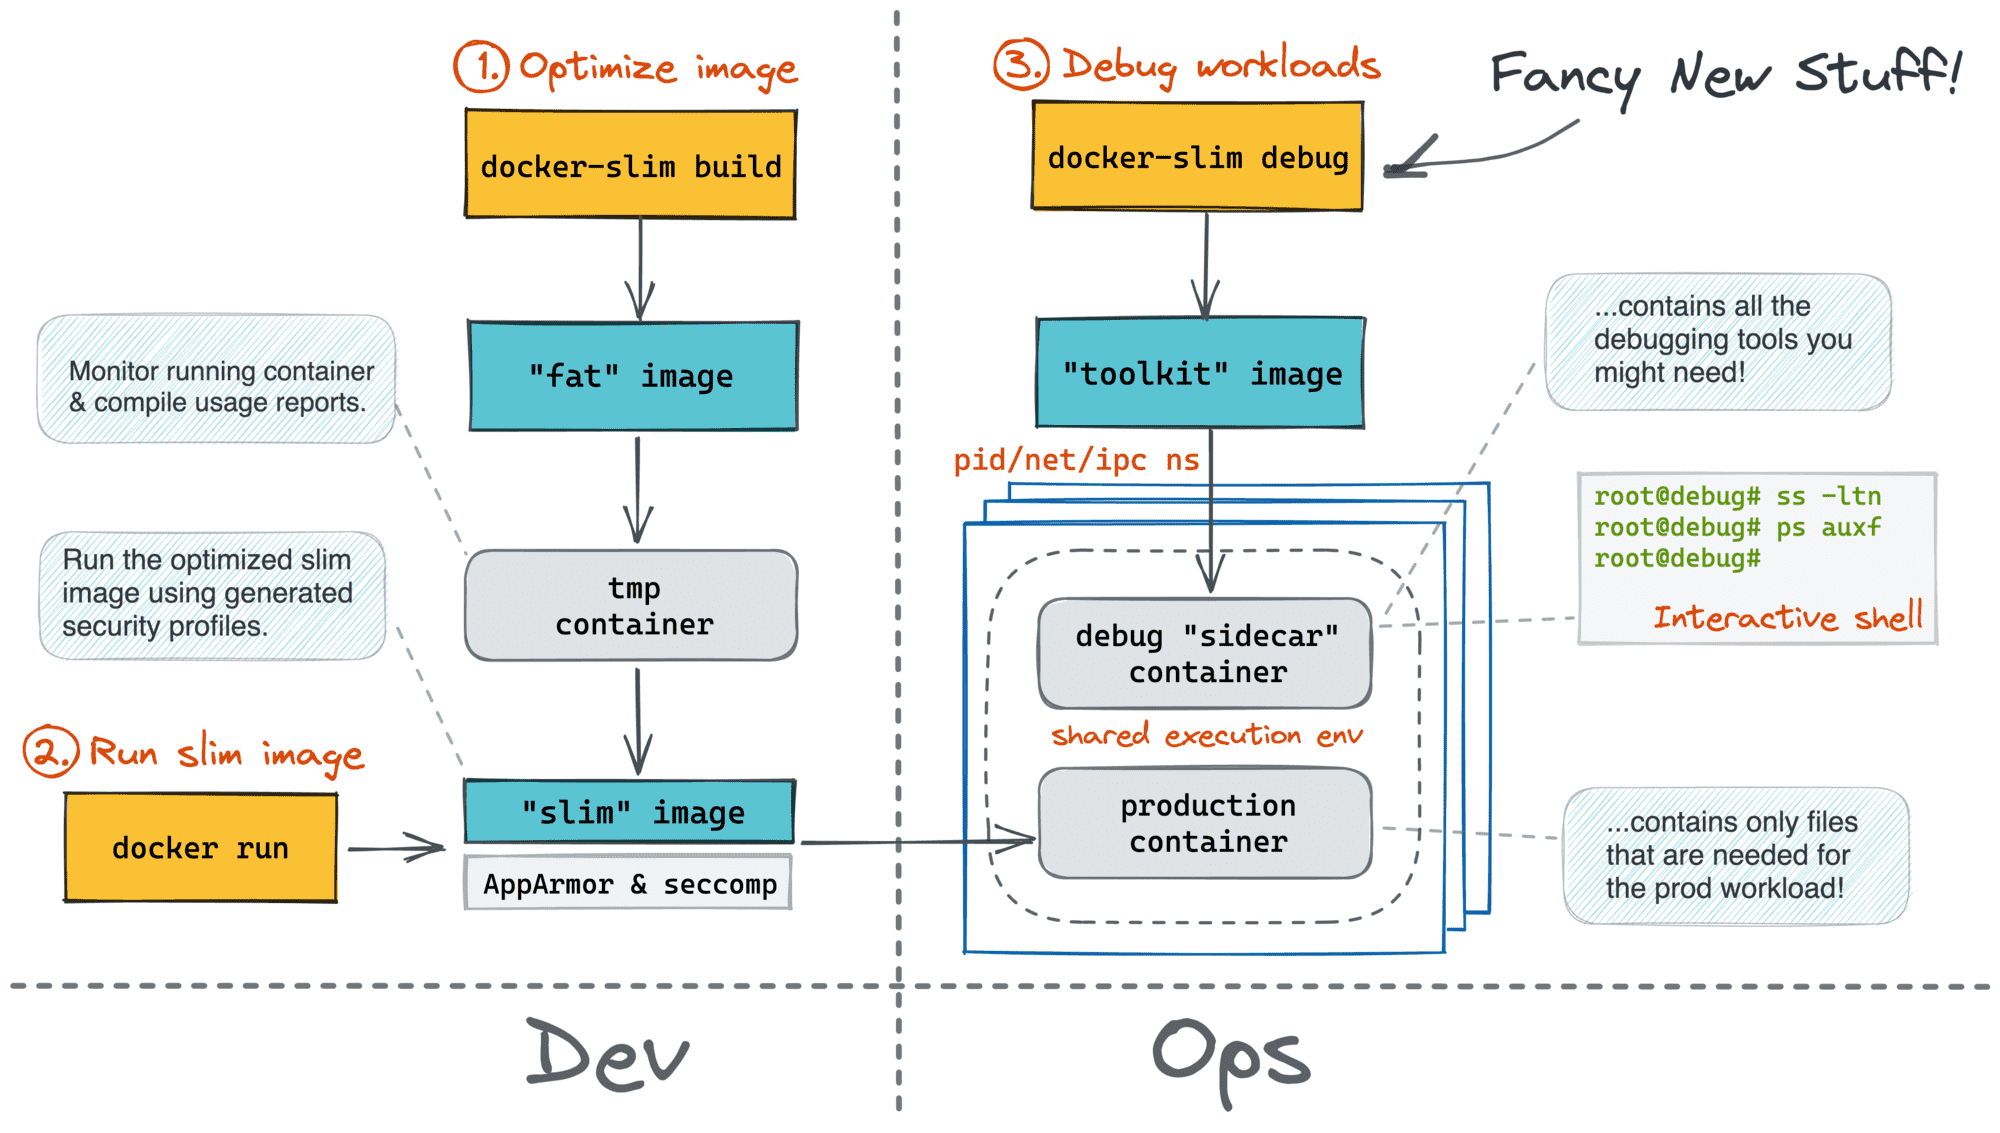
My investigation showed that there are three namespaces that can be shared this way: pid, net, and ipc. The last one, though, can be shared only if the target itself was (re)started with --ipc 'shareable'.
So far, this approach has been my favorite. It lacks most of the downsides of the other approaches - if you don't need a shared ipc namespace, the target container doesn't even need to be restated! But there is one significant con...
The docker run (or docker create) command doesn't allow sharing the mnt namespace. Technically, it's possible for two containers to share the same filesystem. However, Docker (invented?) promotes the image-driven UX - every container starts from an image, and to avoid any collisions, every docker run (and docker create) must initiate a new mnt namespace.
💡 Interesting fact: With nerdctl you can actually run containers without images! Example:
nerdctl run -it --rootfs $(pwd) /<cmd>
It means that the filesystem you see while in the debugger's shell is not the filesystem of the target container!
With the pid namespace shared, you can still access the target's container filesystem using the following trick:
/ $# ls -l /proc/1/root/ # or any other PID that belongs to the target container
But it might be quite confusing and limiting...
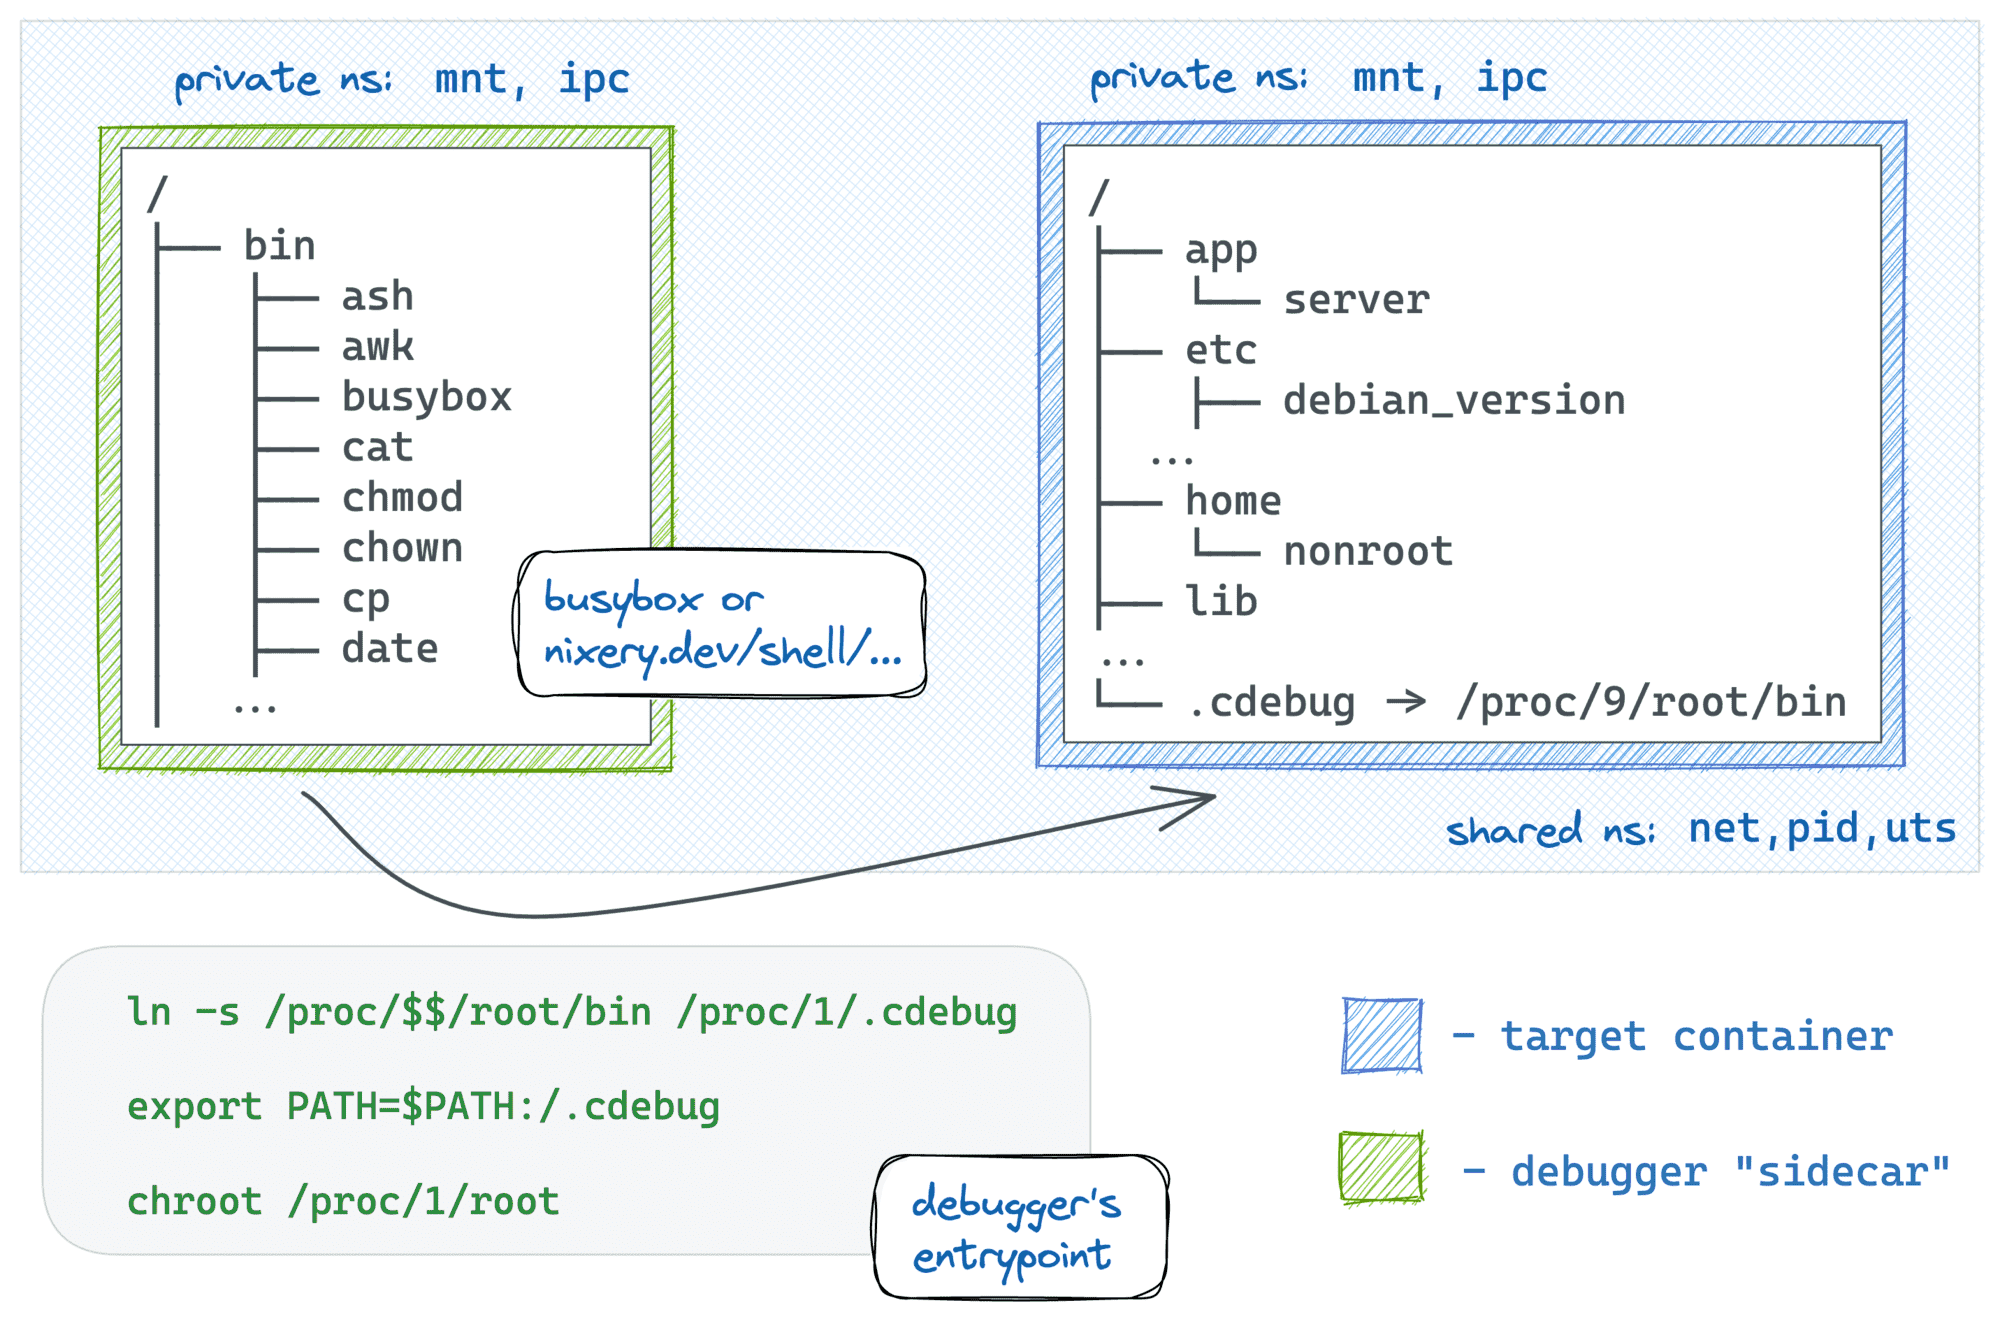
Using docker run, shared namespaces, and chroot
The good news is that a single symlink combined with chrooting of the debugger process can make the debugging session almost indistinguishable from the good old docker exec UX!
I find this trick so handy that I even automated it in my new container debugger tool iximiuz/cdebug. With cdebug, exec-ing into a container becomes as simple as just:
cdebug exec -it <target-container-name-or-id>
The above command starts a debugger "sidecar" container using the busybox:latest image. But if you need something more powerful, you can always use the --image flag:
cdebug exec --privileged -it --image nixery.dev/shell/ps/vim/tshark <target>
Instead of conclusion
Well, that's it for now. And if you know more ways to debug containers, drop me a message or leave a comment. Learning from the audience is one of the main goals behind this blog! 🙌
- Docker: How To Debug Distroless And Slim Containers
- Kubernetes Ephemeral Containers and kubectl debug Command
- Containers 101: attach vs. exec - what's the difference?
- Why and How to Use containerd From Command Line
- Docker: How To Extract Image Filesystem Without Running Any Containers
- KiND - How I Wasted a Day Loading Local Docker Images
Don't miss new posts in the series! Subscribe to the blog updates and get deep technical write-ups on Cloud Native topics direct into your inbox.
