- Prometheus Is Not a TSDB
- How to learn PromQL with Prometheus Playground
- Prometheus Cheat Sheet - Basics (Metrics, Labels, Time Series, Scraping)
- Prometheus Cheat Sheet - How to Join Multiple Metrics (Vector Matching)
- Prometheus Cheat Sheet - Moving Average, Max, Min, etc (Aggregation Over Time)
Don't miss new posts in the series! Subscribe to the blog updates and get deep technical write-ups on Cloud Native topics direct into your inbox.
Here we focus on the most basic Prometheus concepts - metrics, labels, scrapes, and time series.
What is a metric?
In Prometheus, everything revolves around metrics. A metric is a feature (i.e., a characteristic) of a system that is being measured. Typical examples of metrics are:
- http_requests_total
- http_request_size_bytes
- system_memory_used_bytes
- node_network_receive_bytes_total

What is a label?
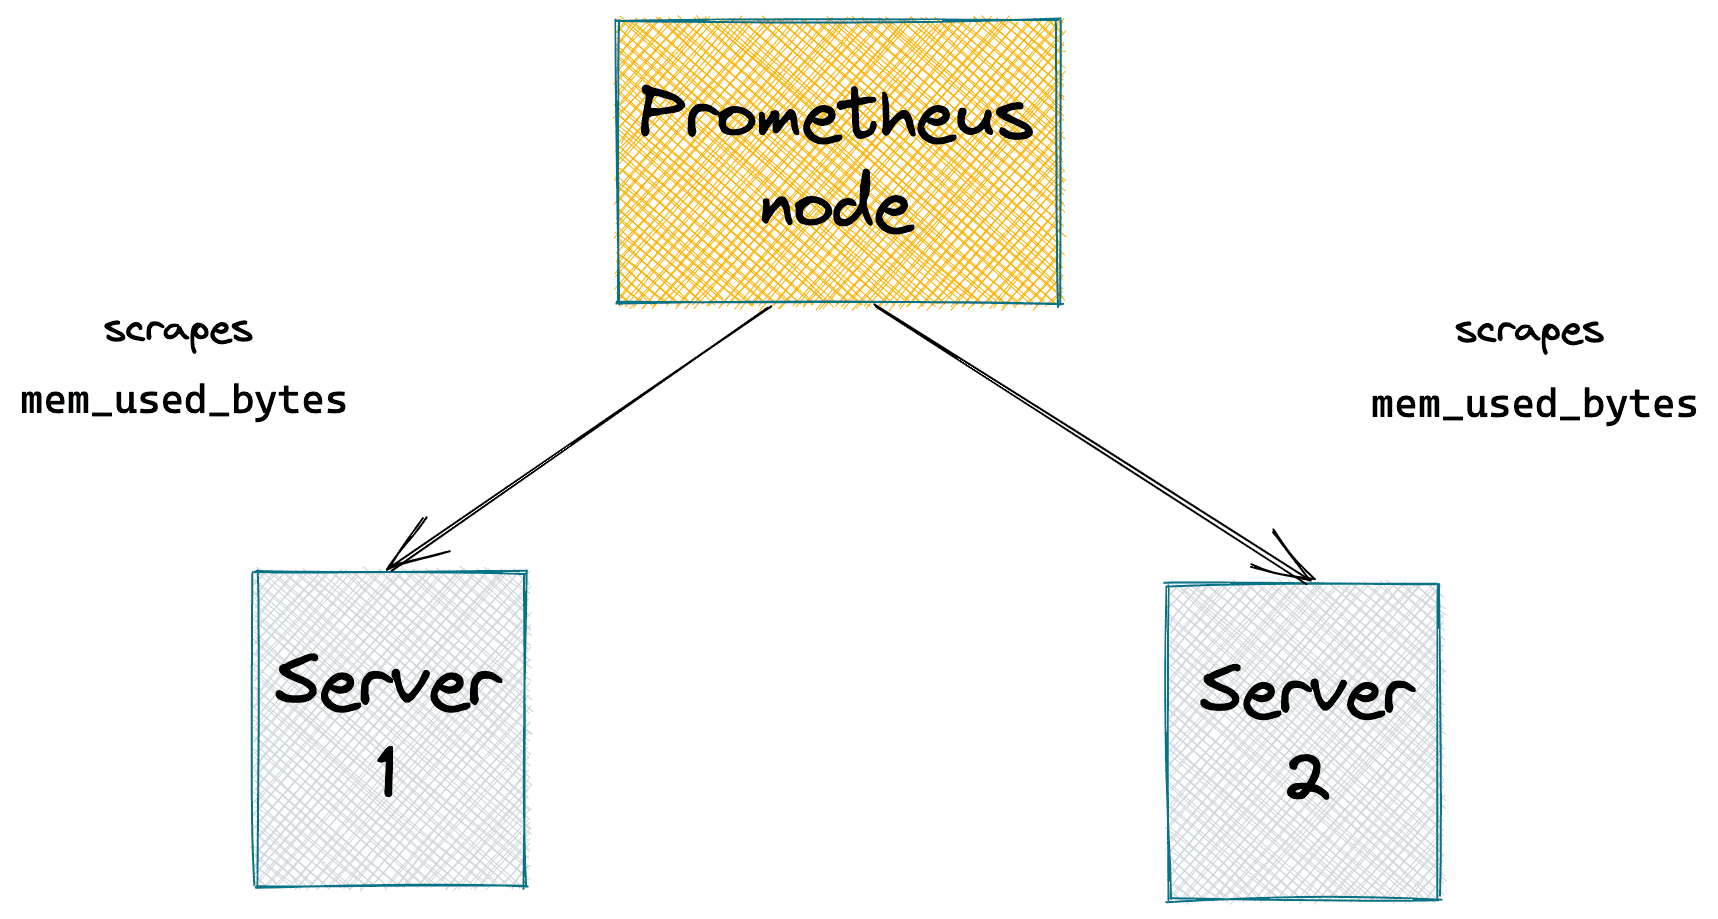
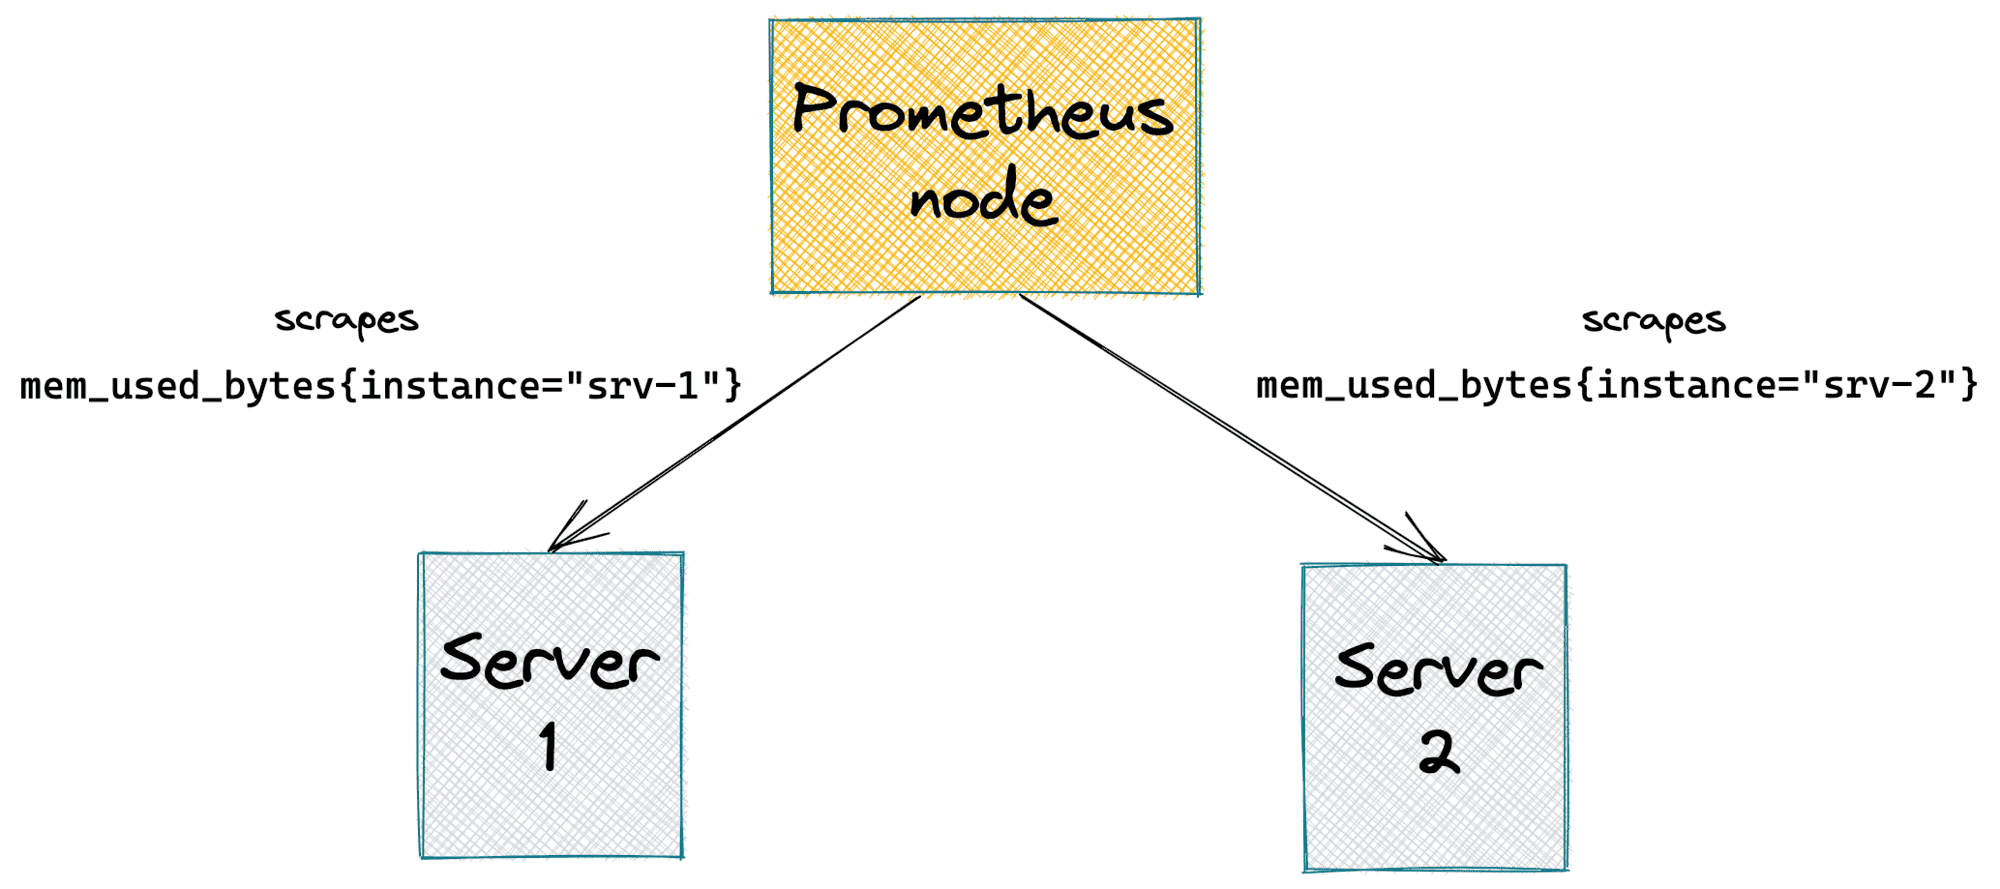
The idea of a metric seems fairly simple. However, there is a problem with such simplicity. On the diagram above, Prometheus monitors several application servers simultaneously. Each of these servers reports mem_used_bytes metric. At any given time, how should Prometheus store multiple samples behind a single metric name?
The first option is aggregation. Prometheus could sum up all the bytes and store the total memory usage of the whole fleet. Or compute an average memory usage and store it. Or min/max memory usage. Or compute and store all of those together. However, there is always a problem with storing only aggregated metrics - we wouldn't be able to pin down a particular server with a bizarre memory usage pattern based on such data.
Luckily, Prometheus uses another approach - it can differentiate samples with the same metric name by labeling them. A label is a certain attribute of a metric. Generally, labels are populated by metric producers (servers in the example above). However, in Prometheus, it's possible to enrich a metric with some static labels based on the producer's identity while recording it on the Prometheus node's side. In the wild, it's common for a Prometheus metric to carry multiple labels.
Typical examples of labels are:
- instance - an instance (a server or cronjob process) of a job being monitored in the
<host>:<port>form - job - a name of a logical group of instances sharing the same purpose
- endpoint - name of an HTTP API endpoint
- method - HTTP method
- status_code - HTTP status code

What is scraping?
There are two principally different approaches to collect metrics. A monitoring system can have a passive or active collector component. In the case of a passive collector, samples are constantly pushed by active instances to the collector. In contrast, an active collector periodically pulls samples from instances that passively expose them.
Prometheus uses a pull model, and the metric collection process is called scraping.
In a system with a passive collector, there is no need to register monitored instances upfront. Instead, you need to communicate the address of the collector endpoint to the instances, so they could start pushing data. However, in the case of an active collector, one should supply the list of instances to be scraped beforehand. Or teach the monitoring system how to build such a list dynamically using one of the supported service discovery mechanisms.
In Prometheus, scraping is configured via providing a static list of <host>:<port> scraping targets. It's also possible to configure a service-discovery-specific (consul, docker, kubernetes, ec2, etc.) endpoint to fetch such a list at runtime. You also need to specify a scrape interval - a delay between any two consecutive scrapes. Surprisingly or not, it's common for such an interval to be several seconds or even tens of seconds long.
For a monitoring system, the design choice to use a pull model and relatively long scrape intervals have some interesting repercussions...
What is a time series in Prometheus?
Side note 1: Despite being born in the age of distributed systems, every Prometheus server node is autonomous. I.e., there is no distributed metric storage in the default Prometheus setup, and every node acts as a self-sufficient monitoring server with local metric storage. It simplifies a lot of things, including the following explanation, because we don't need to think of how to merge overlapping series from different Prometheus nodes 😉

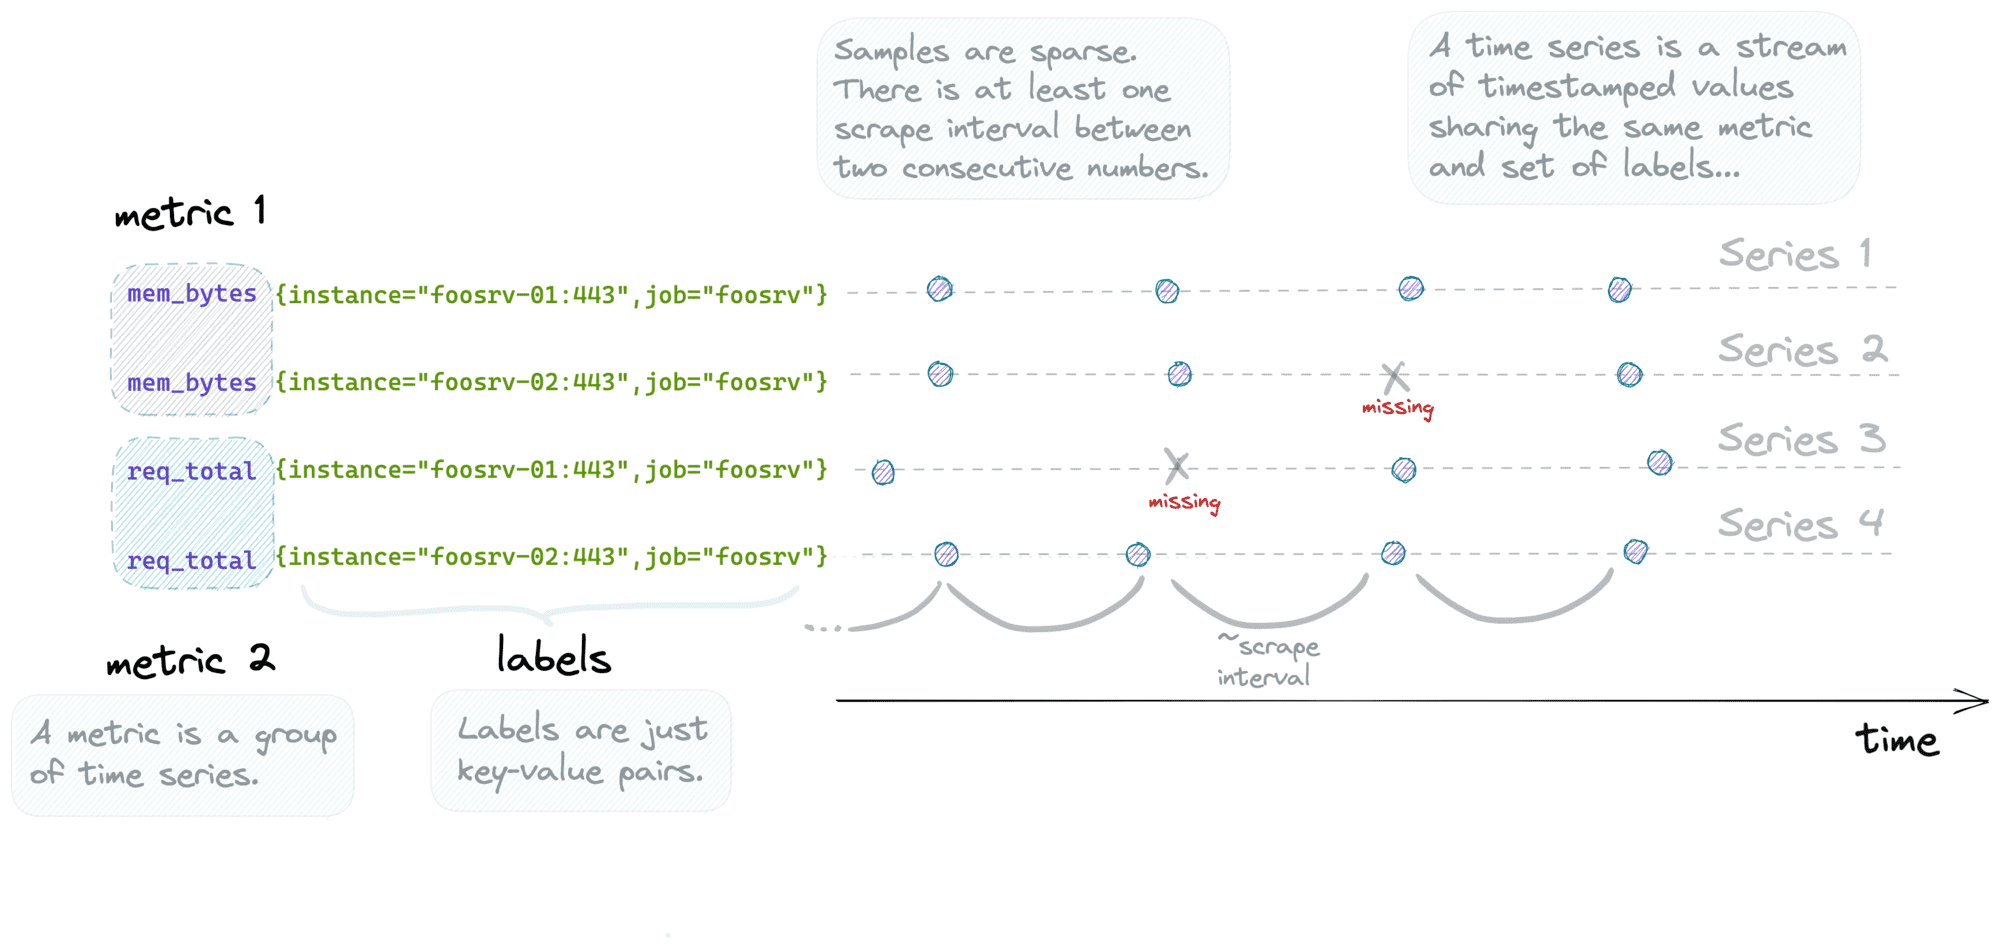
In general, a stream of timestamped values is called a time series. In the above example, there are four different time series. But only two metric names. I.e., a time series in Prometheus is defined by a combination of a metric name and a particular set of key-value labels.
Side note 2: Values are always floating-point numbers; timestamps are integers storing the number of milliseconds since the Unix epoch.
Every such time series is stored separately on the Prometheus node in the form of an append-only file. Since a series is defined by the label value(s), one needs to be careful with labels that might have high cardinality.
The terms time series, series, and metric are often used interchangeably. However, in Prometheus, a metric technically means a group of [time] series.
Downsides of active scraping
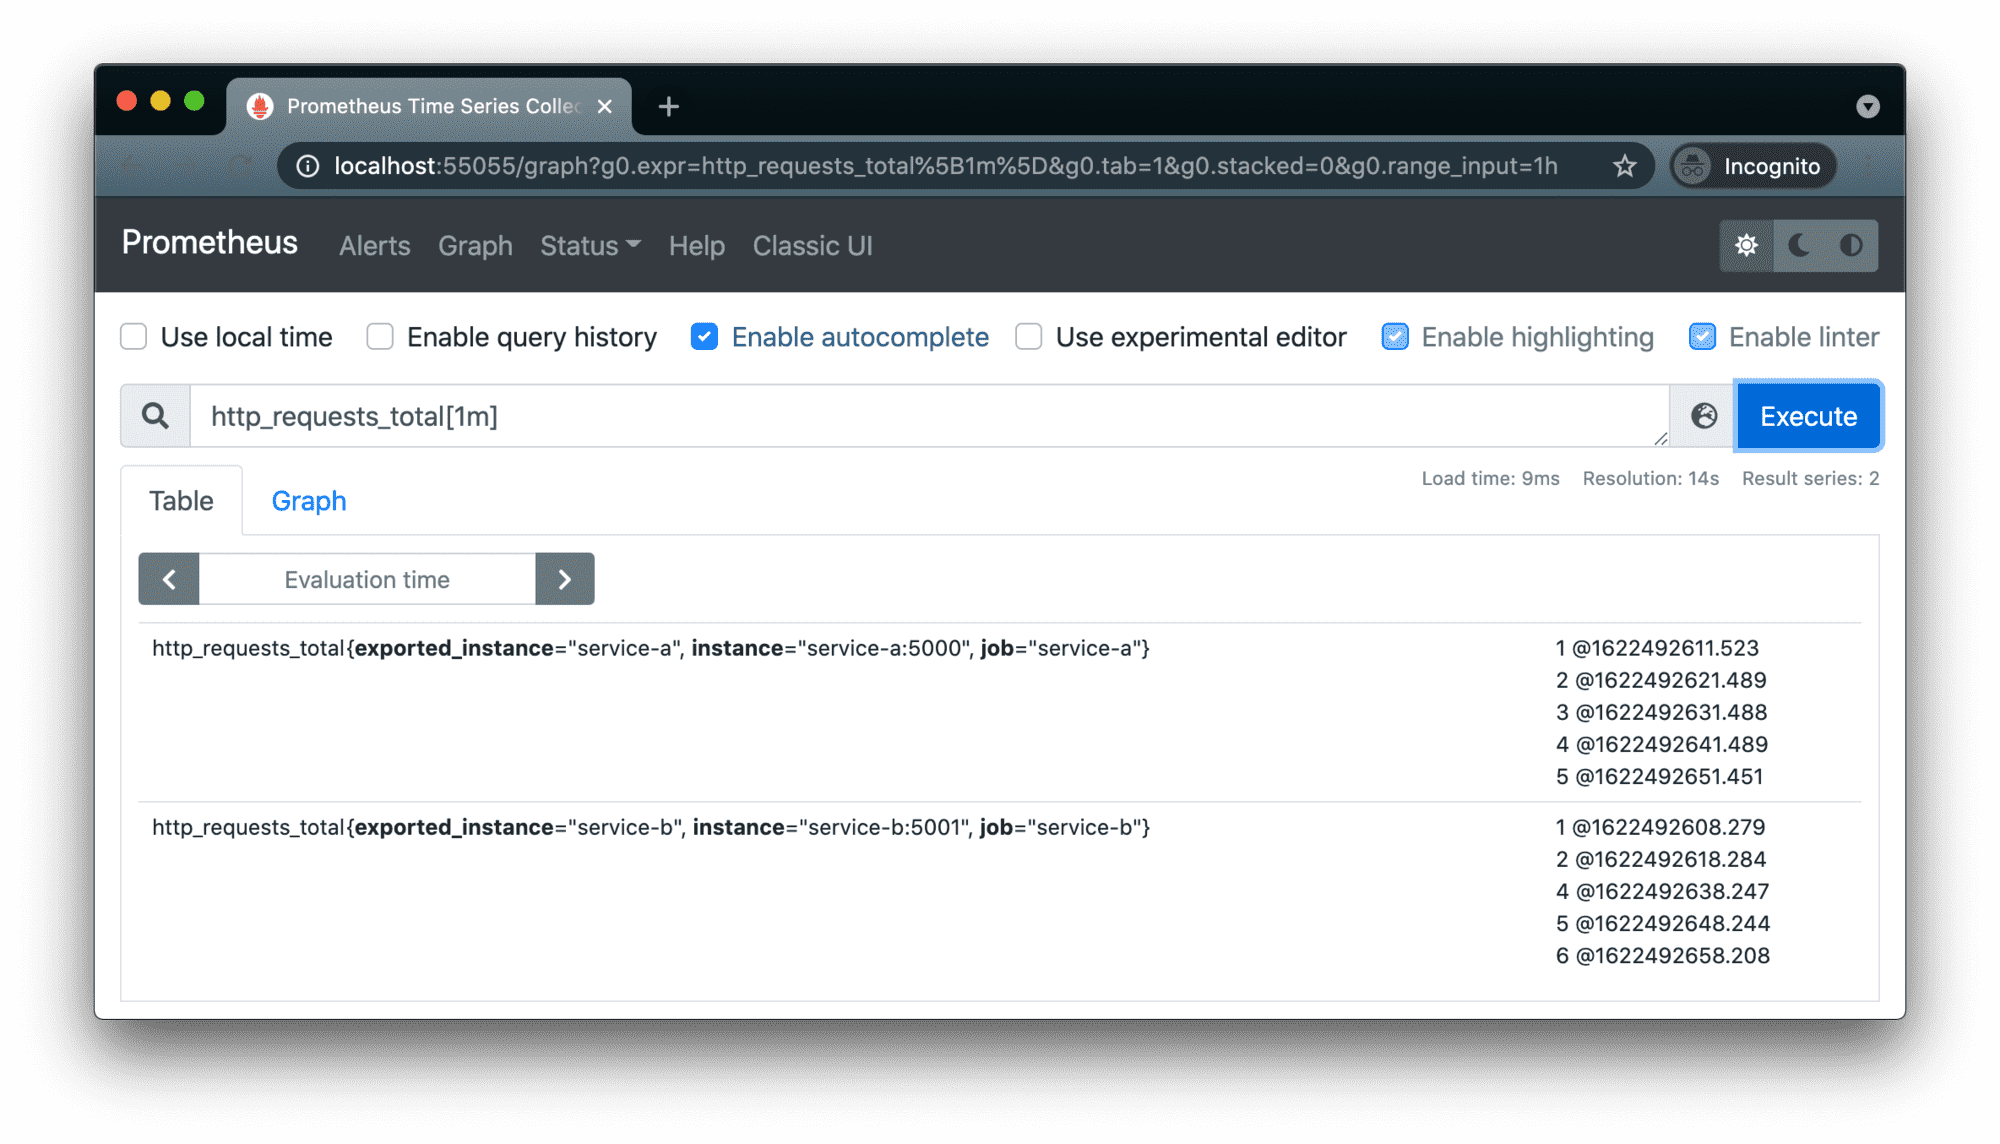
Since it's a single node scraping multiple distributed endpoints with potentially different performance and network conditions, the exact sample timestamps will (although most of the time just slightly) vary for every scrape. Because of that and of the potential loss of some scrapes, the interval between two samples in a given time series is neither constant nor multiplication of the scrape interval. Remember the repercussions I mentioned above?

Prometheus node scraping two services every 10 seconds - actual samples aren't ideally aligned in time.
There is another interesting, more important pitfall to be aware of. If a target reports a gauge (i.e., instant measurement) metric that changes more frequently than it's scraped, the intermediate values will never be seen by the Prometheus node. Thus, it may cause blindness of the monitoring system to some bizarre patterns:
Obviously, counter (i.e., monotonically incrementing measurement) metrics don't have such a problem.
- Prometheus Is Not a TSDB
- How to learn PromQL with Prometheus Playground
- Prometheus Cheat Sheet - Basics (Metrics, Labels, Time Series, Scraping)
- Prometheus Cheat Sheet - How to Join Multiple Metrics (Vector Matching)
- Prometheus Cheat Sheet - Moving Average, Max, Min, etc (Aggregation Over Time)
Don't miss new posts in the series! Subscribe to the blog updates and get deep technical write-ups on Cloud Native topics direct into your inbox.