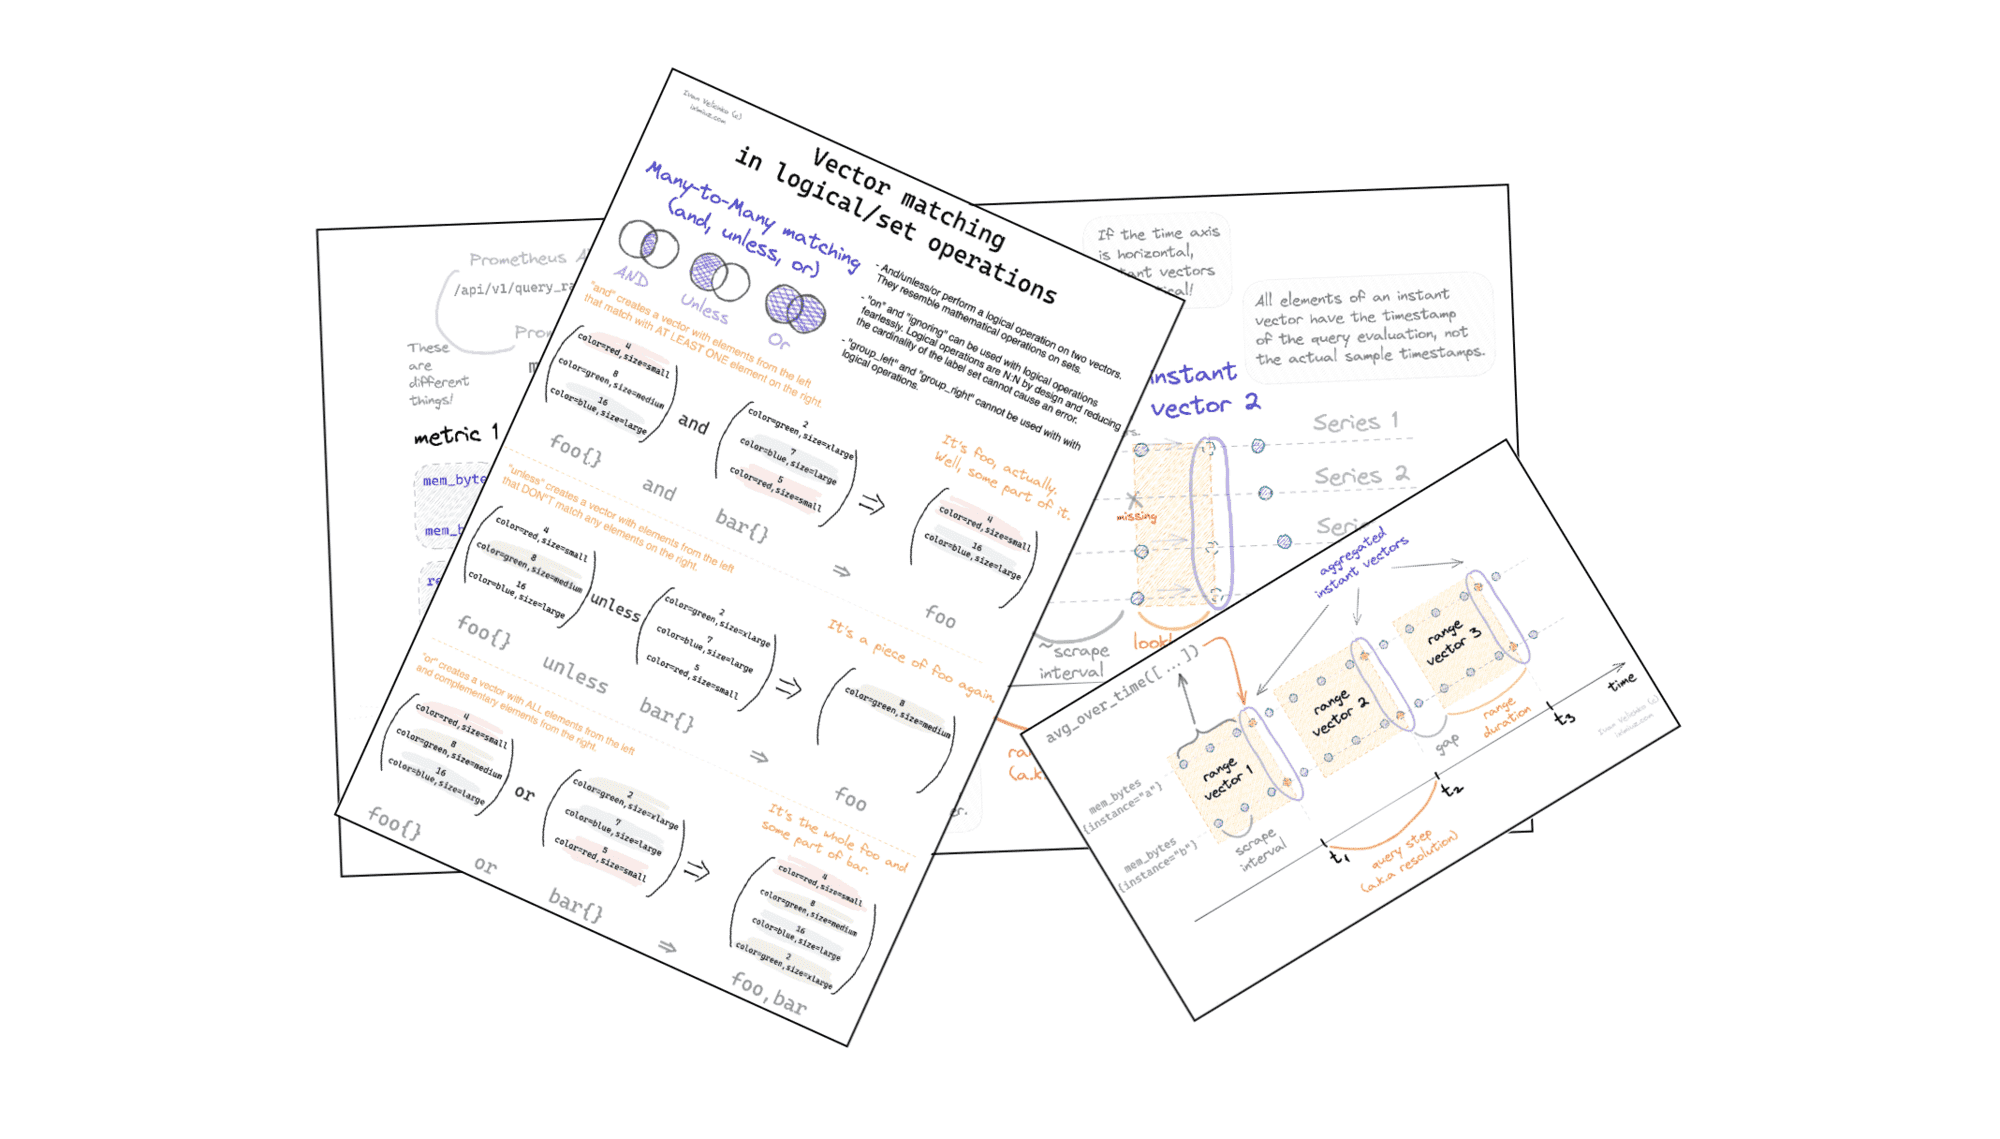
- Prometheus Is Not a TSDB
- How to learn PromQL with Prometheus Playground
- Prometheus Cheat Sheet - Basics (Metrics, Labels, Time Series, Scraping)
- Prometheus Cheat Sheet - How to Join Multiple Metrics (Vector Matching)
- Prometheus Cheat Sheet - Moving Average, Max, Min, etc (Aggregation Over Time)
Don't miss new posts in the series! Subscribe to the blog updates and get deep technical write-ups on Cloud Native topics direct into your inbox.
Misconception - the right word to explain my early Prometheus experience. I came to Prometheus with vast Graphite and moderate InfluxDB experience. In my eyes, Graphite was a highly performant but fairly limited system. Metrics in Graphite are just strings (well, dotted), and the values are always stored aggregated with the lowest possible resolution of 1 second. But due to these limitations, Graphite is fast. In contrast, InfluxDB adopts Metrics 2.0 format with multiple tags and fields per metric. It also allows the storage of non-aggregated data points with impressive nanosecond precision. But this power needs to be used carefully. Otherwise, you'll get all sorts of performance issues.

For some reason, I expected Prometheus to reside somewhere in between these two systems. A kinda-sorta system that takes the best of both worlds: rich labeled metrics, non-aggregated values, and high query performance.
And at first, it indeed felt as such! But then I started noticing that I cannot really explain some of the query results. Like at all. Or sometimes, I couldn't find evidence in metrics that just had to be there. Like the metrics were showing me a different picture than I was observing with my eyes while analyzing raw data such as web server access logs.
So, I started looking for more details. I wanted to understand precisely how metrics are collected, how they are stored, what a query execution model is, et cetera, et cetera. And at first, I was shocked by my findings! Oftentimes, the Prometheus behavior didn't make any sense, especially comparing to Graphite or InfluxDB! But then it occurred to me that I was missing one important detail...
Both Graphite and InfluxDB are pure time-series databases (TSDB). Yes, they are often used as metric storage for monitoring purposes. But every particular setup of these systems comes with certain trade-offs and bolt-on additions addressing performance or reliability concerns. For instance, there is often a statsd-like daemon in front of your Graphite doing preaggregation; you use different rollup strategies for older data points, etc. But normally, you are aware of that. So when you query the last couple of days of metrics, you expect them to have a secondly precision. But when you query something a week or a month old, you already know that each data point represents a minute of aggregated data, not a second.
However, Prometheus is not a TSDB.
Prometheus is a monitoring system that just happens to use a TSDB under the hood. So, some of these trade-offs one would usually find in a typical Graphite installation were already taken by Prometheus authors. But maybe not just all of them were made clear in the documentation 🙈
So, when I would find a certain query producing quirky results, it would be due to my misunderstanding of Prometheus as a whole, not just its query execution model. Aiming for results that would be reasonable for a pure TSDB apparently may be way too expensive in a monitoring context. Prometheus, as a metric collection system, is tailored for monitoring purposes from day one. It does provide good collection, storage, and query performance. But it may sacrifice the data precision (scraping metrics every 10-30 seconds), or completeness (tolerating missing scrapes with a 5m long lookback delta), or extrapolate your latency distribution instead of keeping the actual measurements (that's how histogram_quantile() actually works).
Once I realized this difference, I reconsidered my expectations from the system. However, I still needed a better way to understand the PromQL's query execution model than the official documentation provides. There is also plenty of Prometheus and PromQL articles out there, but they give you just a shallow overview of the query language. Only a sweeping search finally revealed these two much more profound resources - PromLabs' blog and Robust Perception's blog. Both are apparently written by Prometheus creators.
But practice is even better than reading 😉 So, I went ahead and hacked a local Prometheus playground to solidify my learnings. And of course, I'm always striving to write down stuff on the way, mostly for future me, but feel free to check out my other Prometheus posts:

- Prometheus Is Not a TSDB
- How to learn PromQL with Prometheus Playground
- Prometheus Cheat Sheet - Basics (Metrics, Labels, Time Series, Scraping)
- Prometheus Cheat Sheet - How to Join Multiple Metrics (Vector Matching)
- Prometheus Cheat Sheet - Moving Average, Max, Min, etc (Aggregation Over Time)
Don't miss new posts in the series! Subscribe to the blog updates and get deep technical write-ups on Cloud Native topics direct into your inbox.